Crypto Academy / Season 3 / Week 6 - Homework Post for @asaj: Vortex Indicator Strategy
Hello Everyone, so today I invite you all to read today's Homework on Vortex Indicator Strategy subject which is given by Professor @asaj.
So let us continue with our homework.
So as we know, Vortex Indicator was developed by Etienne Botes and Douglas Slepman in 2010, and it was basically made to use in the stock for many years and then starts using in the Crypto world as well.
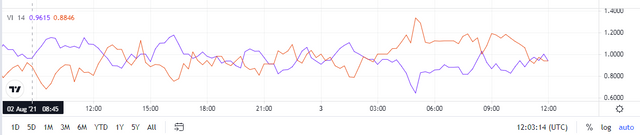
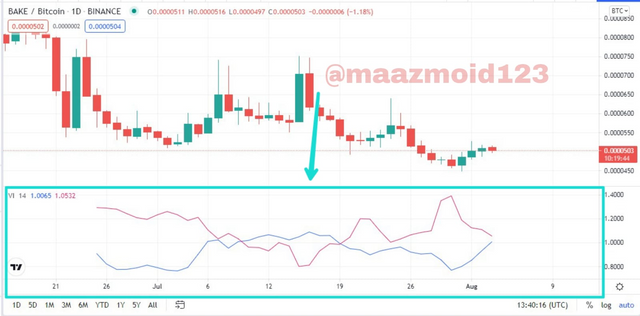
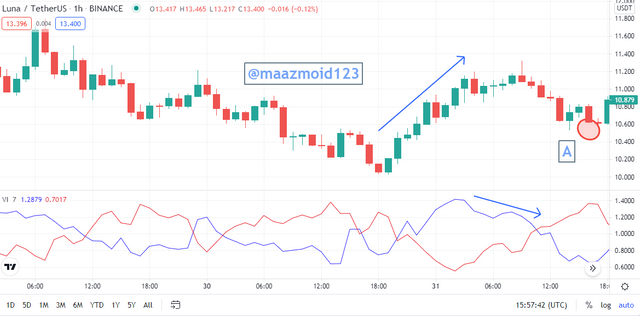
So as we can see that Vortex Indicator have two lines of two different colors of our choice as here I have the blue and orange line. In which one is to see the positive trend of the market while the other one is used to see the negative or bearish trend of the market. And when these lines cross each other it creates buy and sell signals.
Here in the above screenshot Positive Vortex Indicator or VI+ is shown from the blue line, as it shows the positive movement of the market. While the Negative Vortex Indicator or VI- is shown from the orange line, as it shows the negative movement of the market.
Now I guess we have to see that how this indicator works? So it works on the time period and it is derived by calculating the distance between the highs and lows within certain time periods as the professor had told us about in the lecture.
So in this, there are some main things we have to see that: if the length of the current period is high and of the last period is low then the market is in uptrend or moving in a positive direction but if the length of the between the current period is low and of the last period is high then the market in a downtrend or going in a negative direction.
And just like most of the indicators which we use if the distance between the 2 lines is wider then the trend will be smooth or stronger which can be positive and negative.
How the Vortex Indicator is Calculated:
As I also have told above the Vortex Indicator establishes the trend of the market by seeing the current period and the last period of the market. As if the current period is high and the last period of the market is low then it is a positive market and vice versa for the negative trend.
And to see the current and last period we usually use the 14 periods and it is also suggested to use 14 periods but we can also use fewer periods for more early signals in low time frames. And we can also use higher periods such as 28 for the more accurate signals.
As it is an Indicator and the work of the indicator is to help the trading in technical analysis of the asset before buying and selling of the asset. And to see if the Indicator is reliable or not we have to work on it for some time to see if it makes any mistakes in between the trading or not.
And as I never used this indicator before so I thought to answer this question in the last as I will do some real-life trading with the help of this indicator which I also have shown below in other questions.
And I think the Vortex indicator is a reliable indicator but the main thing we have to see in that is the length numbers as in normal market we should use 7 or 14 lengths for more fast and accurate indication and in fluctuation market, we should use 28 or 30 lengths, which reduces the margin of the error due to fluctuations and volatility in price.
As for the traders if the blue line crosses the orange line it is a buy signal as the market goes in the uptrend of the bullish trend. And if the orange line crosses the Blue line then it is a selling signal as the market is going in the downtrend or the bearish trend.
Below I am gonna show you all how we can add the Vortex indicator to a chart.
So let's add the vortex Indicator in a chart:
- So firstly we have gone to the tradingview.com.
- Then I launch a chart of BAKE/BTC.
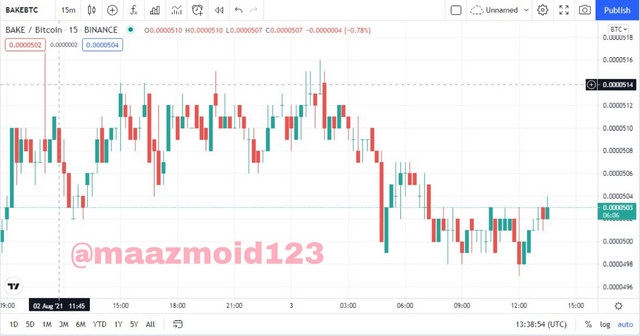
- Then we have to click on the Indicator Option to put the Vortex indicator.
- Here I then enter the Vortex Indicator and then select it for the chart.
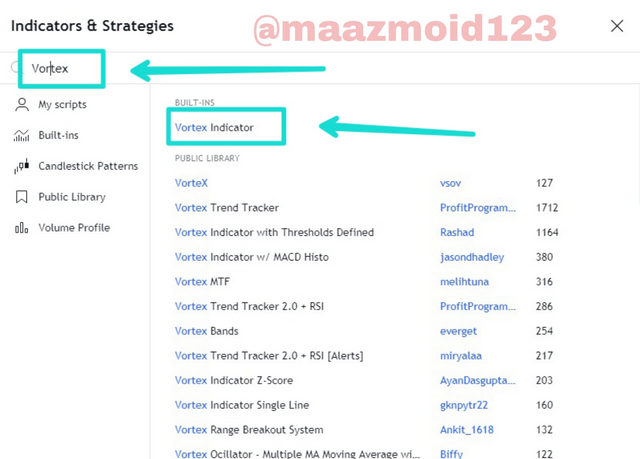
- As you can see that the Vortex indicator has been added to the chart.
what are the recommended parameters:
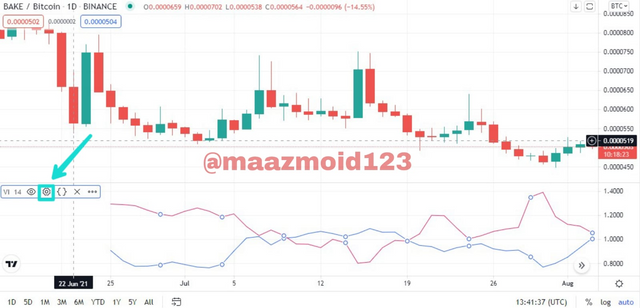
So firstly let's see how to enter its settings:
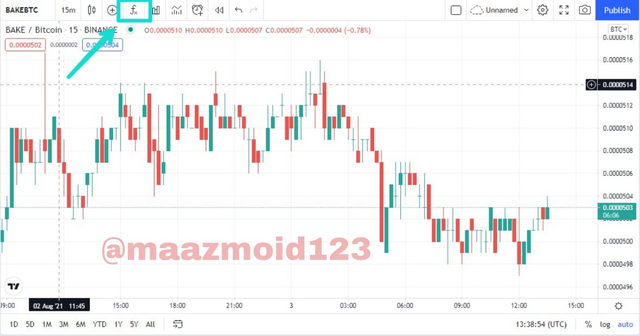
- So here tap on the IV to see more options.
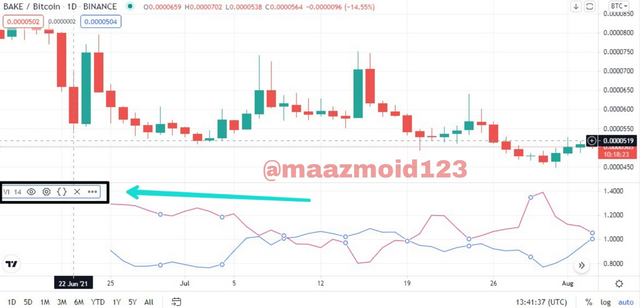
- Then click on the settings.
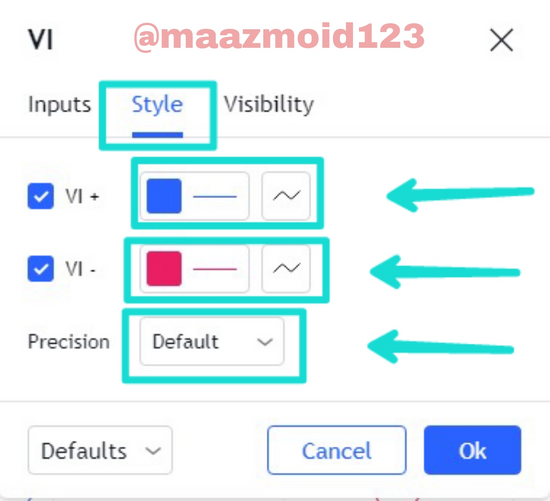
- Then in settings on the Input tab, we can select the color of the lines of our choice and will put the precision on Default.
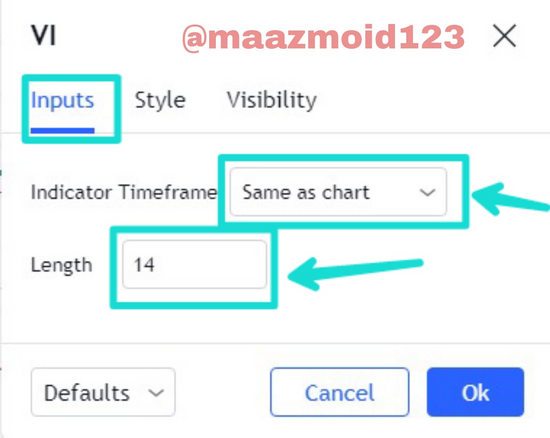
- Then we will click on the Input tab there we will put the Indicator Timeframe same as Chart and the length of our choice but as usual and the recommended length of it is 14 but we can change to as per the condition and time frame of the market.
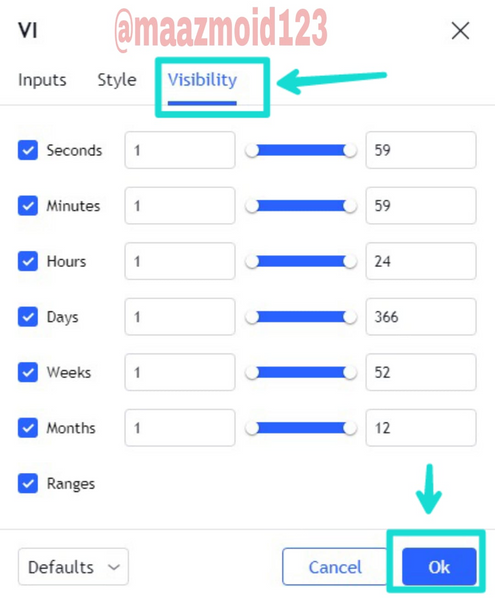
- Will set the Visibility to Default.
So the divergence is when the chart and the indicators go in the opposite directions. As we can see that there are two types of Divergence of the vortex Indicators which are the Bullish and Bearish Divergence.
The VI+ is the blue line and shows the positive movement of the market.
While the VI- is the orange line which shows the negative movements of the market.
The Bullish Divergence happens when the VI+ trendline which is the Blue line goes into the higher high while the chart price movement goes into a Lower high. It is seen as the buying signal for the traders.
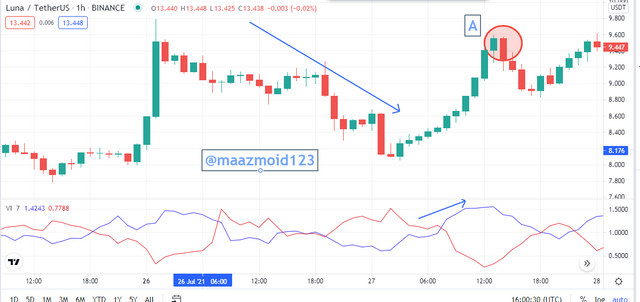
The Bearish Divergence happens when the VI- trendline which is a blue line goes into the lower high while the chart price movement breaks the previous high or you can say the price movement go up for a moment and then goes down so it serves as the selling signal for the traders.
So as the professor asked to buy and sell any two cryptocurrencies according to the signals of the Vortex indicators, so here I am with the buying and selling crypto currencies according to the Signals of VI.
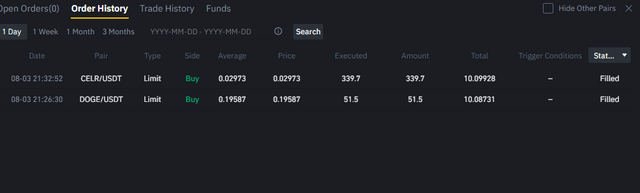
BUYING DOGE:
- So firstly I open my Binance account as I only use this exchange and then I check on the Assets on which I wanted to invest so I like the Doge prices for now.
- so I invested 10 USDT on it
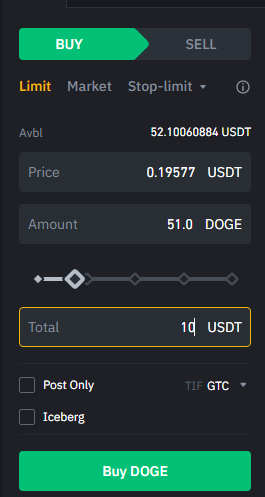
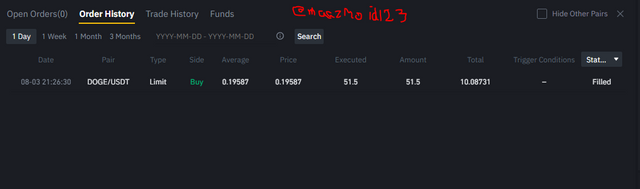
- Now the order is done
BUYING CELR:
- The second coin I choose to invest in is the CELR.
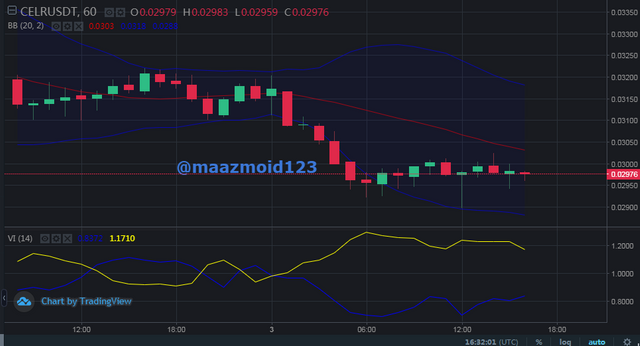
- I also invest 10.1 USDT in that.
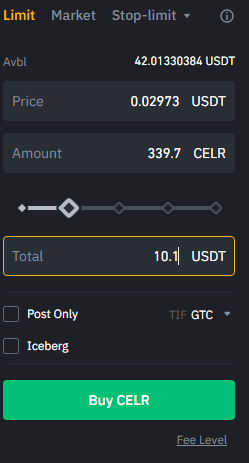
- And then the order is placed now.
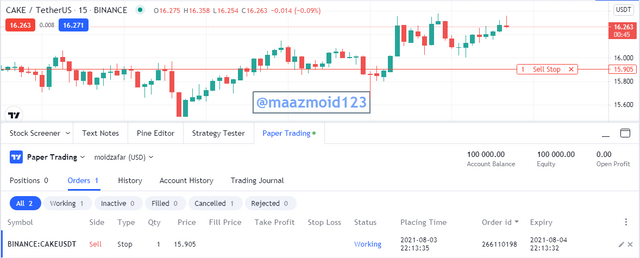
SELLING CAKE
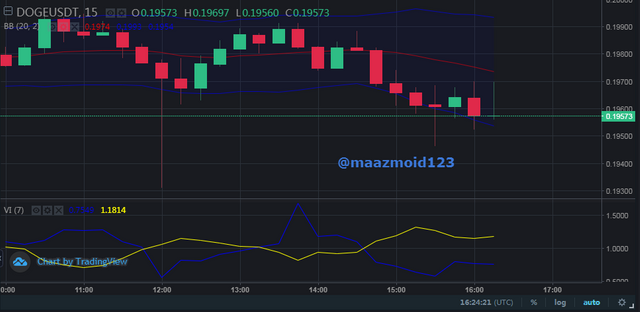
- So here I enter into the tradingview.com and I made a sell order of CAKE as we can see in the VI Indicator it is the best moment to sell the asset
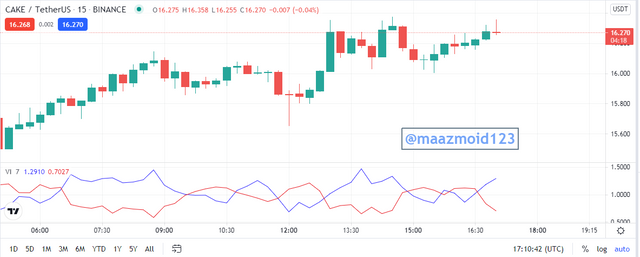
- Then made a sell order
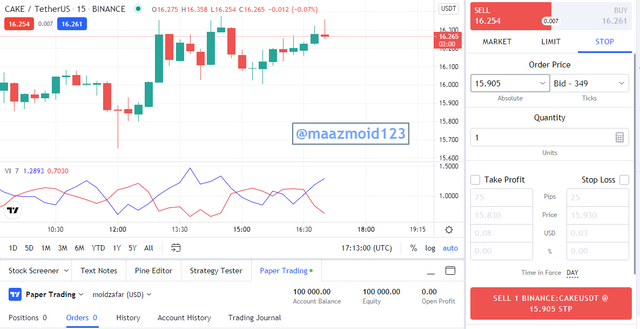
- Finally can see the done order.
So finally the topic has come to an end and as always it was really an interesting topic and I have learned a lot from this today as well. As we all know that the indicators provide information related to technical analysis of the asset of our choice.
As I have personally been working on the MACD and Bollinger Bands but now as the professor has shown in the lecture that if we use 7 length period so it shows signals faster than the MACD and because of that we can exit and enter the market at the best time.
I hope to get more profits from this indicator as I personally will work on this indicator and get more experience in this indicator to make it out best in trading.
Regards,
Superb performance @maazmoid123!
Thanks for performing the above task in the sixth week of Steemit Crypto Academy Season 3. The time and effort put into this work is appreciated. Hence, you have scored 8 out of 10. Here are the details:
Remarks
Originality and uniqueness shines through the way you chose to express yourself. It made this article a pleasant read. I also noticed you understand the meaning of VI divergence with price chart.
Though the charts you presented in task 4 isn't a perfect illustration of divergence, you did good. Thanks for sharing your work with us.
Thank you professor, Will try to be more expressive in my next homewrk.