Crypto Academy Season 6 Week 2 : TRADING STRATEGY WITH RSI + ICHIMOKU
Hello Everyone. Welcome back to the Steemit Crypto Academy after a short break. This is my first post as a Crypto Professor in Season 06 0f the academy.
So in this season, we have focused mainly on the assignments related to trading. So my very first lesson is about an interesting trading strategy with RSI + ICHIMOKU. I'm sure that almost all of the traders are aware of this strategy, if not, then they may learn through this lesson. So without any delay, let's start the lesson.
 Cover Image Created by Canvas
BACKGROUND
In crypto trading, there are many strategies, every strategy has its usefulness and harmfulness. But traders, mostly okay with simple noncomplex indicators strategies. Such as RSI, MACD, Stochastic, etc. And they provide wrong and right signals. That is why traders want strategies that fit in their style and have a decent win rate too. Many traders want a strategy that can win in scalp trading and trend trading. Meanwhile both the trading methods have their own style of indicators. Those who give you the scalp signal give you at the expense of the trend. Vice versa in another way around therefore the strategy I’m going to present is the strategy that can work in both situations and has a very decent win rate for me. It is surely at top of the list in my good book
The strategy I’m going to teach you is how to use RSI+Ichimoku Clouds. But first, the question is why RSI and Ichimoku Cloud aren’t good individually for that we will first their them individually with their faults.

FAULTS AND FEATURES OF RSI INDIVIDUALLY
RSI stands for relative strength index, which means that it shows the strength of bulls or bears, the strength of buyers and sellers. That means it tells you that currently in the market whether the buyers are in control or sellers. That impact greatly in the market, therefore, it contains a line that oscillates around 100–0 to show the strength of the indicator. But we will discuss its faults here.
The first and foremost fault is it doesn’t work when there’s a trend, because it’s giving a signal at the expense of the trend. It happens like this. When buyers control the market the line will move to 70 but then to go to above then that the requirement of buyers in the market increases, that is why when the trend starts it fails to identify it significantly and those who opened a short position, after considering that market is overbought get liquidity
The second fault is it doesn’t tell how much volume is entering the market. It can be predicted by the movement of the line but it won’t even be accurate to take serious investment decisions.
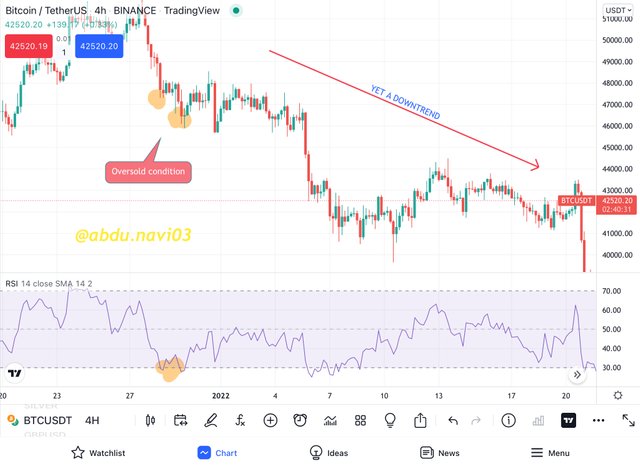
It is easily identified that in a trend it does not work and does not give the right signals. As the selling of more market can not be identified by this indicator.
FAULTS AND FEATURES OF ICHIMOKU INDIVIDUALLY
Ichimoku clouds were developed by Goichi Hasoda and it is such a brilliant indicator that it provides more data points than simple traditional candlesticks do. Its calculations consist of 5 moving averages of different kinds and as result, they formed a cloud-like structure that predicts the support, resistance, trend, and momentum.
But Ichimoku also lacks where every moving average lacks, this indicator lacks, and by the time we pick the trend, it's already gone. So in easy words, it can not predict the movement of buyers or sellers in the market fast enough to make better entries and exits.
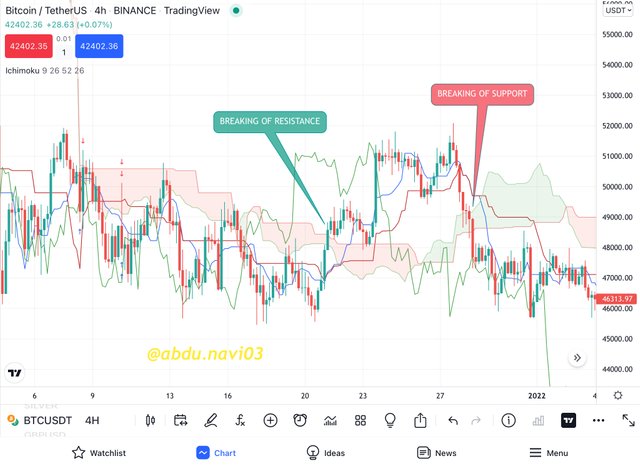
It is easily identified that in this sideways market, price oscillates and the support and resistance forms by Ichimoku cloud breaks by the price several times but still no trend is followed just buyers and come, took profit and left. This is what that Ichimoku cloud can’t detect.
EFFECT OF COMBINATION OF BOTH
Well as I explained RSI lacks trend identification and Ichimoku lacks the tracking of traders' movements into the market. Therefore by combining them, we can develop a strategy that can not only let you learn the movement of traders and get you before any trend starts, or any scalp opportunity generates but it can also keep you in the long run if you want to be in a long run with that trend. In case of trend, your scalp can be a trend or in case of reversal, you can just quite the trade at the right time.
In these examples, you can see how these two indicators back each other’s back and save from false signals. They are saving themselves but let's learn their combined use step by step.
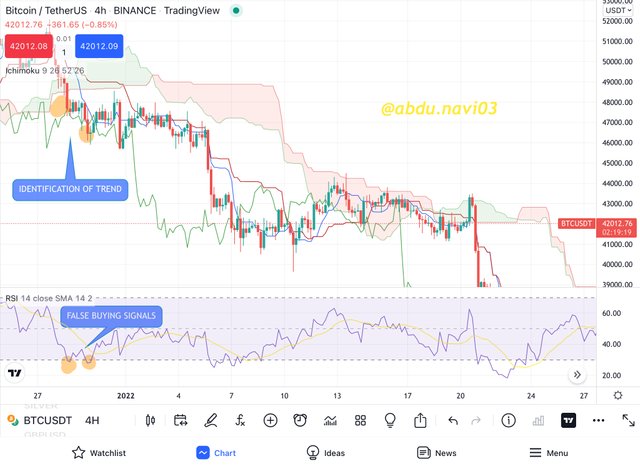
TREND IDENTIFICATION BY THIS STRATEGY
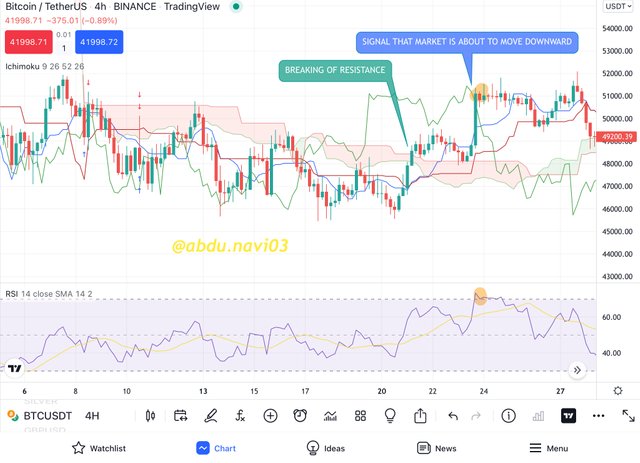
Most of you already know that 80+ RSI may be known as an overbought area but it is also a signal of strong buying pressure, therefore, either at the start of a strong uptrend or in an uptrend, RSI forms a double top with an RSI line. The line of RSI goes to the overbought region, and after some correction again hits the overbought region, it identifies the upward trend. But identifying in this way means missing a hard and important volume of candles that can be profitable. In this problem, Ichimoku clouds can be used. If the price is above the clouds of Ichimoku clouds then it's an uptrend. Meanwhile, the size of the cloud will tell us the volume in the market which RSI fails to tell.
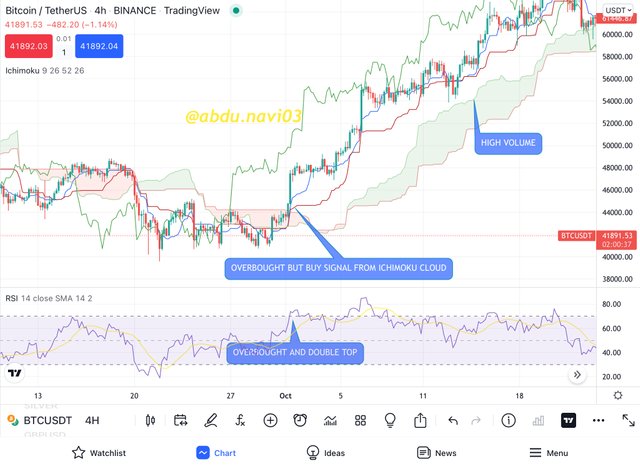
In this way, we can identify the trend when there is one. You might be thinking why do we need RSI here, because first reason is, to buy at the dip and the second reason is, in case of coming of reversal, the line of RSI will go to below 50, marking that the users are exiting the market, RSI would help to secure the most profit.
USE OF MA WITH THIS COMBINATION
Traders are also advised to use either EMA or MA with it if they find Ichimoku complicated. A trader can use EMA or MA upon his/her trading strategy. I will use MA and will show you the settings I’m using with this.
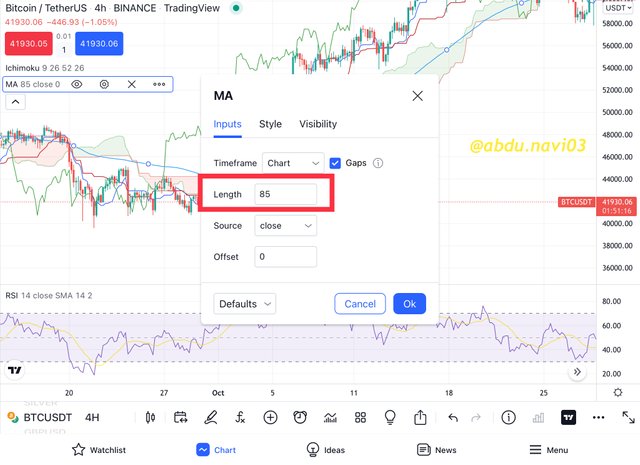
Changing length is advisable with these two indicators, though you can use any other length if that suits you.
By combining MA or EMA trader has now another trend indicating a signal with whom he is familiar and low length is not suggested because there is a low length indicator MA installed in the Ichimoku already. It prevents any other slight chances of falling into false signals by this strategy.
SUPPORT AND RESISTANCE WITH THIS STRATEGY
To understand its support and resistance, one thing must be clear that in trend Ichimoku cloud will be used as the guardian angel, and sideways RSI will be. In simple words, trend support and resistance are identified by the Ichimoku, and that criteria be followed. But in a sideways market RSI overbought and oversold region will strictly follow.
IN TREND
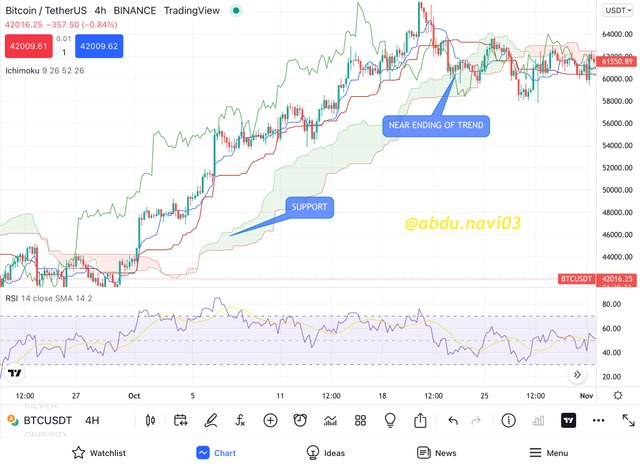
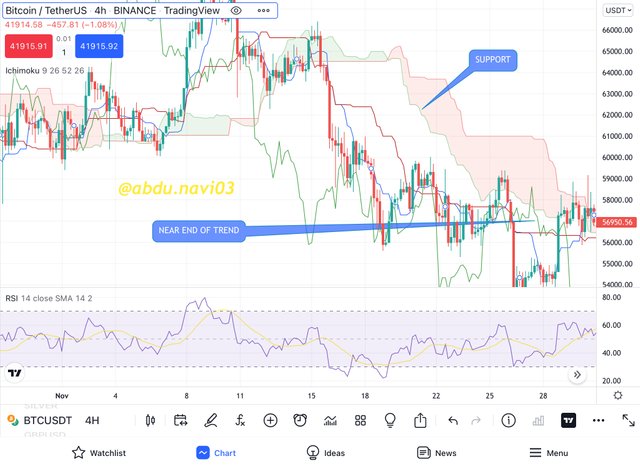
The below examples are of support and resistance in trend. In trend Ichimoku cloud will be used, if they are green, they’ll be considered as support and if they are red they’ll be considered as resistance. Upon breaking of them we must consider the trend to be over. Meanwhile, another thing that is very important is the distance of price from the cloud, the more the distance, the more the trend is strong.
IN SIDEWAYS MARKET
In a sideways market, Ichimoku doesn’t work best but RSI does so its RSI, who gives information about support and resistance and tells us about the people's current interest in the market.
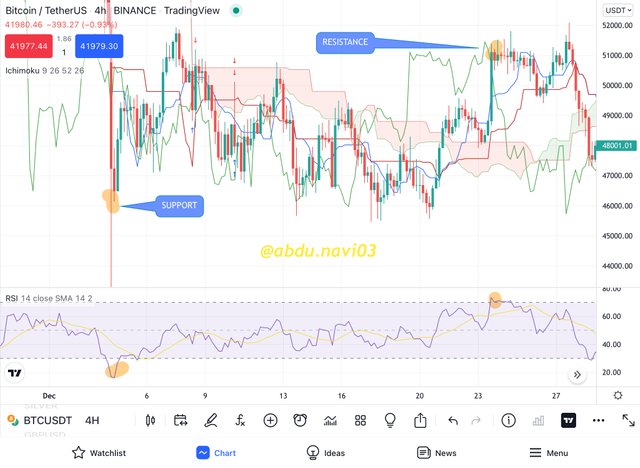
In a sideways market, the overbought and oversold areas of RSI work as resistance and support, but a trader can also shorten the trading zone to 60-40 for getting more success in this kind of dangerous market.
ENTRY AND EXIT CRITERIA BY THE STRATEGY
So in trend catching the entry and exit criteria is simple. Enter in your trade, when RSI indicated it and it breaks the Ichimoku cloud too near that time. That means that people come into the market and then the prices are pumped soo much that they pass the Ichimoku clouds. That’s the Best signal by this trade. It can either be long or short.
Meanwhile, the exit doesn’t depend upon the RSI in trend-catching.
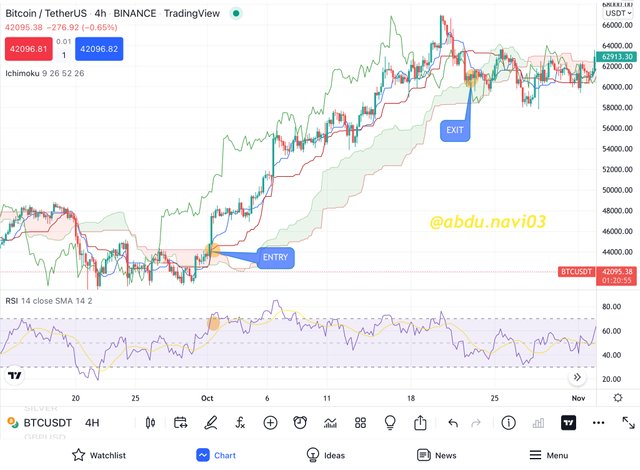
CONCLUSION
In this strategy, you can see that exit solely depends upon the ending of the trend. That would be indicated by Ichimoku clouds
This strategy is a very good strategy for filtering both of their individual flaws. It covers both of their false signals and increases the win rate. In a different situation, it works differently but it saves traders from traps. This indicator though is very good for spot trading only as following a trend will cause a lot of funding fees. In any case, it is not recommended in futures or leverage trading. But it can bear very good if any project looks good and you want to invest, this strategy can help you find you buying a spot in big-time frames. By using them traders can have knowledge about almost all the important aspects of the market.
HOMEWORK
1-Put your understanding into words about the RSI+ichimoku strategy
2-Explain the flaws of RSI and Ichimoku cloud when worked individually
3-Explain trend identification by using this strategy (screenshots are required)
4-Explain the usage of MA with this strategy and what lengths can be good regarding this strategy (screenshots required)
5-Explain support and resistancet with this strategy (screenshots required)
6-In your opinion, can this strategy be a good strategy for intraday traders?
7-Open two demo trades, one of buying and another one of selling, by using this strategy
GUIDELINES
Be sure to post your assignment in the Steemit Crypto Academy Community
Before making a post read thoroughly the lesson
Add proper tags for this assignment including #abdu-s6week2, #cryptoacademy, and also don't forget to add the tag #club5050 if you are eligible for it. You can also add some other tags such as #rsi and #ichimoku. Also add the tag of your country, eg mine is #pakistan
Your assignment must contain at least 600 words
Don't forget to add the reference and source of the images used in your assignment and there should be your username as a watermark in every screenshot you use in the assignment.
You may also tag me in your assignment when you post it. (@abdu.navi03)
You may create your Homework Title like [Trading strategy with RSI and ICHIMOKU]- Steemit Crypto Academy- Homework post for Professor @abdu.navi03 by (your username)
Plagiarism will not be tolerated at any cost so try to be creative and unique and look out for originality.
Your account must not be in a power-down process and you must have a minimum SP of 250 and a reputation level of 60 in order to be eligible for grading.
Also buying votes from bots is not allowed in the Steemit Crypto Academy so try to avoid it or otherwise you will not be graded.
Your Homework task must be submitted before 11:59 pm(GMT)on Saturday and for Pakistani users, it is 4:59 am Sunday
If you are not graded after the 48 hours of the submission of your assignment, you can drop the link of the assignment in the comment section of this post. But before that wait, your assignment will be graded, and try to avoid spam commenting.
After all of this, if you have any questions regarding my lesson, you are most welcome to ask in the comment box.
regards,
Professor @abdu.navi03
It is task for week 2.
Anyways nice strategy. Looking for participation.
Noted. Thanks for letting me know
Hi professor, thanks for this lecture this week. I’m gonna take the lessons soon. I think there is a mistake with the title, instead of week 2, you put week 1. Kindly check and correct.
Corrected. Thank You for rectifying me.
Waiting for your entry. Good luck
Hi, @abdu.navi03,
Thank you for your contribution to the Steem ecosystem.
Please consider voting for our witness, setting us as a proxy,
or delegate to @ecosynthesizer to earn 100% of the curation rewards!
3000SP | 4000SP | 5000SP | 10000SP | 100000SP
Good day my professor @abdu.navi03
Pls it's over 48hrs already and my assignment has not been graded, pls kindly help me look into it, thanks sir.
https://steemit.com/hive-108451/@feyol55/trading-strategy-with-rsi-and-ichimoku-or-steemit-crypto-academy-or-homework-post-for-professor-abdu-navi03
Asalam o alaikum
a interesting lecture you engage both solid indicators and I will surely participate in your lecture professor @abu.navi03
Professor, I need your clarification on this question. does that mean we have to explain the shortcomings of each indicator without being combined or the shortcomings of these two indicators after being combined?
Sorry for my confusion, thank you.
Shortcoming without being combined. There flaws when we use individually
Congratulations, your post has been upvoted by @scilwa, which is a curating account for @R2cornell's Discord Community. We can also be found on our hive community & peakd as well as on my Discord Server
Felicitaciones, su publication ha sido votado por @scilwa. También puedo ser encontrado en nuestra comunidad de colmena y Peakd así como en mi servidor de discordia
This was a great lecture professor.
Greetings professor, this is my post link and it has not been graded yet
https://steemit.com/hive-108451/@acbaby/trading-strategy-with-rsi-and-ichimoku-steemit-crypto-academy-homework-post-for-professor-abdu-navi03-by-acbaby
Hello professor @abdu.navi03 my task has not yet been graded and it’s three days old sir
https://steemit.com/hive-108451/@nackasnelson/trading-strategy-with-rsi-and-ichimoku-steemit-crypto-academy-homework-post-for-professor-abdu-navi03-by-nackasnelson