[Trading strategy with RSI and ICHIMOKU]- Steemit Crypto Academy- Homework post for Professor @abdu.navi03 by @acbaby

Hi steemians, welcome to my homework task for this second week of the academy. I will be talking about a strategy that combines the Ichimoku clouds indicator and the RSI indicator. This strategy can also add other indicators such as the EMA. I will be describing all the processes involved in carrying out analysis for trading using this indicators strategy.
The RSI and ichimochu indicators are the same as normal indicators used in trading technical analysis. There are several different indicators in the technical analysis space and the one to be used will depend on the analysis model to be used by the trader and the expected outcome. In carrying out trading analysis, traders prefer non complex technical analysis tools such that they can easily utilize and understand the outcomes. Examples of such indicators are the SMA, EMA, RSI,MACD, and the Stochastic Oscillator. Irrespective of their purpose, they can give false signals to a trader but to counter this false effect, a different approach can be used by applying a confluence of more than one indicator such that the other(s) act as filter for the main indicator for the analysis.
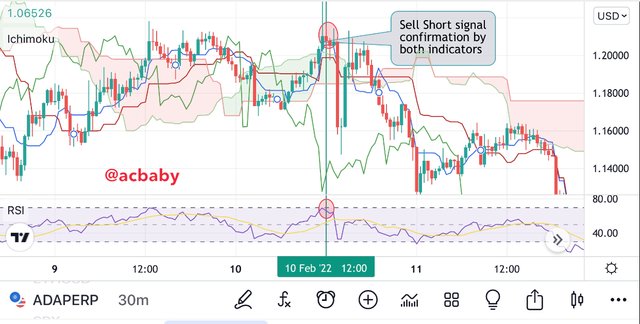
The RSI indicator is an indicator that gives signals at overbought and oversold zones such that it identifies points of weak bullish or bearish momentum such that reversal signals are recorded. The Ichimoku indicator on the other hand works as a range within the trend such that it keeps the fluctuation rates of oscillation within the price and signals points of resistance or support breakouts by flowing clouds. Both indicators complement each other such that the RSI gives a buy or sell signal and the Ichimoku signal must confirm a bullish or bearish breakout respectively before the signal is considered a true signal. In a case where both indicators are giving opposite signals it’s considered false and out of confluence.
The Relative Strength Index is an indicator with a zero level and positive upside and a “negative” downside such that it recognizes and signals the strength and weakness of the bulls and bears in the market. Therefore when the buying pressure reduces the RSI gives a reversal signal to the opposite side and the same works for the weakness or strength of the sellers. The oscillation of the RSI line moves within a range of 100 to 00 such that a center point considered the zero level is at 50. Therefore from 50 to 100 is the positive upside and from 49 to 00 stands for the negative downsides. The strength and weaknesses experienced in the market is readily seen on the RSI even though signals can be false.
Irrespective of the value that the RSI indicator has in the financial markets, it also has fleas in it’s operations. Most at times the disadvantages experienced on using the RSI indicator comes from the misuse of this indicator. Despite misuse, the RSI still has loopholes. These limitations are described below.
Firstly, the RSI indicator is not good to use alone in confirming or executing an entry. Most at times traders use this indicator only to identify opportunities in the market at the level of preliminaries while adding other indicators to satisfy their curiosity. This is due to the ability for the RSI indicator to identify the oversold and overbought zones on the price chart but lack the ability to identify if such opportunities reflect entries of sizes of positions. This gives the RSI indicator a lot of limitation into independent use.
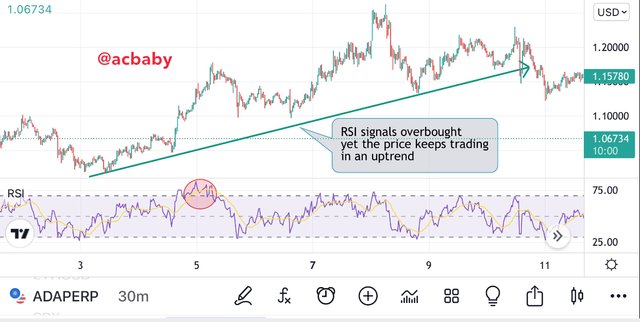
Secondly, the RSI indicator can appear less accurate when the price trend is very strong and as such, the trader is left to think out of the utility of the RSI indicator. Even though the RSI can offer good information in a very strong trend, using this indicator in such situations requires extra caution.
Thirdly, the timeline to which a trend reversal will stay existing is not given by the RSI indicator instead the RSI only says the will be a reversal in h the next market move. This therefore puts the trader on the market and keeps him left out until the market begins to go against the signal from the RSI. That's when the trader can understand that the reversal is at its end. Even when the RSI signals a sell position at the overbought zone, it can still take some time before the trade enters the profits zone since the price can stay for a while at the overbought area.
Lastly, the RSI can tell you that the market is at an overbought price but it cannot tell you the current volume of the overbought market. This is quite a bit of an answer but leaving some questions unanswered.
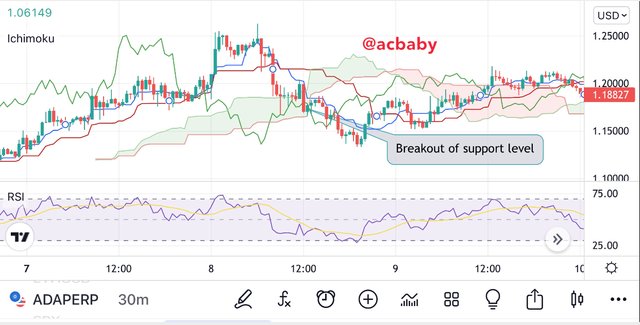
The Ichimoku cloud indicator shows the support and resistance levels as well as the momentum and the direction of the trend of an asset on the price chart. The cloud-like structure on the chart is what identifies the support and resistance or the trend and momentum and also predicting possible breakouts for entries to be made.
Despite all these good activities, there are some limitations on this indicator. Below are some flaws of the Ichimoku cloud indicator.
The first common flaw of this indicator is that it has the ability to produce false signals just like any other indicator. Signals solely depend on the timeframe and so some certain signals can be hidden within the indicator while at some point false signals can be dished out.
The second reason is that this indicator gives signals based on historical data of the price movement. Irrespective of the fact that historical trends may repeat, it’s not in every case that it will work out well.
Lastly, during the sideways market movement, the support and resistance frowned, can break falsely without any trend taking place. This failure is seen especially during liquidity injections.
The best way to use these indicators is to apply them in confluence so that one complements the other as a filter indicator. Such a strategy will enable a trader to understand the trend movement of the asset before it even begins.This already gives a trader an edge over the market such that more profits can be made upon setting positions using this strategy.
Using this strategy to understand price trends can be done by putting together the utility of both indicators in understanding the price trend of the market. Whenever the RSI lines trades into the 80+ area it’s considered an uptrend and when it is in the 20 below area it’s considered a down trend. This gives an idea of a buying pressure at the overbought and selling pressure at the oversold zones but lacking the volume signals. On the other hand we apply the volume indicated by the Ichimoku clouds to this information. Therefore when the RSI is at the overbought (80+) and the price is trading above the Ichimoku cloud, we have an uptrend and if the RSI is below the 20 area (oversold) and the price is trading below the Ichimoku clouds, we have a down trending market. The Ichimoku clouds size gives us the volume of the buying pressure and seeking pressure at every given time.

In a very general sense, we can say that when the price trades above the 50 levels of the RSI indicator and the price also trades above the Ichimoku clouds we have an uptrend and if the clouds are large enough we can depict the volume of buying. The other way round, if the price trades below the Ichimoku clouds and also below the 50 levels of the RSI, we have a downtrend.
Sometimes upon reversal the RSI may form double tops for a previous bullish trend and double bottoms for a previous bearish trend.
Like I said from the beginning, indicators are best used in confluence with other indicators in order to confirm signals and prevent false signals coming from the market. Another good indicator that can be used with the RSI + Ichimoku clouds imatrategy is the Moving Average (MA). Any moving average can be used but in this case I will use the Exponential Moving averages in confluence with this strategy in order to best satisfy my curiosity Iphone taking signals from my indicators.
In this case I will show how to use double EMA alongside this strategy and how to get information positively. Normally, when price trades below the EMA it signifies a downtrend and when it’s above the EMA it signifies an uptrend. With the double EMA we have a downtrend when the price trades below the higher length EMA and the lower length EMA. Therefore when the price is above both EMA lines we have an uptrend and when it’s below we have a downtrend.
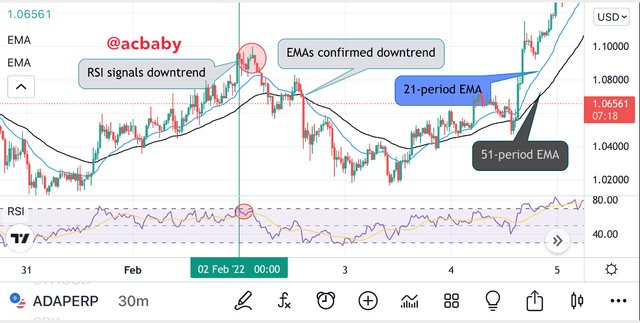
The above screenshot shows the 51-period EMA and the 21-period EMA on the chart along with the RSI indicator. I couldn’t add the Ichimoku clouds because of the limitation of only 03 indicators at a time given by Tradingview.
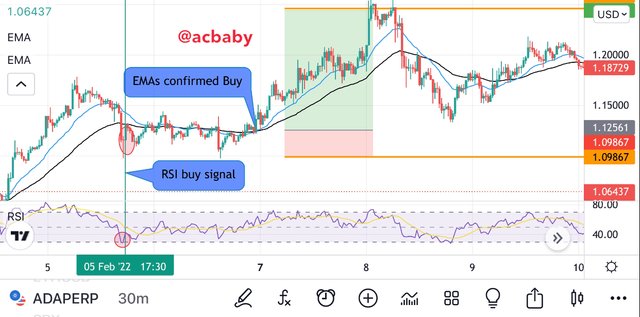
The EMAs work in confluence with the RSI such that they give us very clear signals. When the two EMA lines cross each other, they give a signal and if the 51-period crosses and stays above the 21-period while the price trades below them, we have a bearish trend signal and we can make a short entry if the RSI also signals in the overbought zone. The reverse is true for a Long trade entry.

If we use only one EMA line, we can add the Ichimoku clouds and when the conditions of the Ichimoku cloud are fulfilled with that of the RSI, we check if the price is trading below or above the EMA line. If all 03 indicators say the same thing, we go ahead and make an entry. In this case the EMA will be of 85-period.
The support and resistance levels are a fundamental step in understanding technical analysis in cryptocurrency trading. Knowing how to identify such situations is best for any cryptocurrency trader.
I explained in the other section how the Ichimoku clouds are used for the identification of support and resistance levels. So in a good trending market such as a bull run or a bear run, I will use the Ichimoku clouds for the identification of support and resistance levels while I will use the RSI as the key indicator in identifying the support and resistance where there is a consolidation in the market.
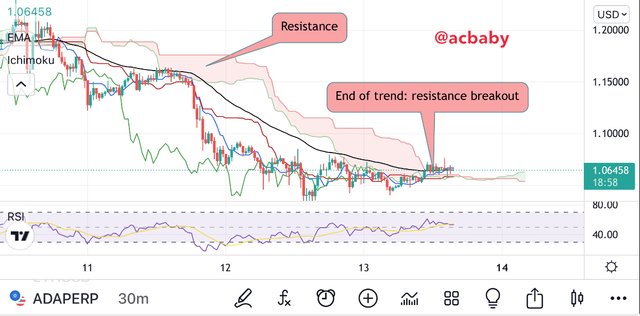
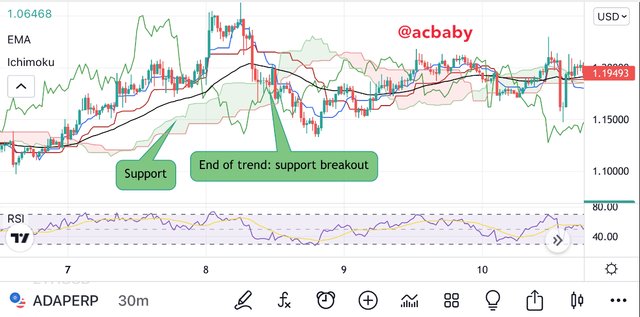
For the trending market, I will look at the Ichimoku clouds wishing the chart in order to pick out points of support and resistance. The colour of the Ichimoku cloud plays a vital role in its operation with regards to support and resistance identification. The green clouds stand for the support area while the red parts are for the resistance. The further away the price trades from the clouds is the stronger the market movement in that direction. Therefore price trading close to the clouds signifies a weak momentum that may lead to a possible reversal.
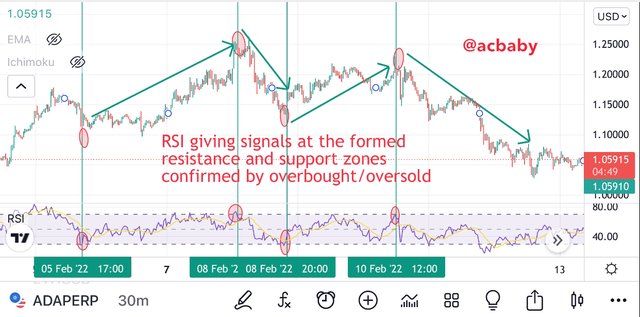
In a ranging market the target indicator for identification of support and resistance is the RSI indicator. Here the overbought zones stand for the resistance level while the oversold zoned stands for the support levels. Notwithstanding, sometimes the price may not trade into the overbought or oversold areas and as such it will form an immediate support or resistance in that specific range but this will not last until we see the price again in the oversold zones r overbought where we can clearly state out support and resistance levels.
I think this strategy is a good one for intraday trading because in whatever time frame the RSI indicator always has a signal to give to the trader so that you can make entry and exit within some minutes, hours or whatever time frame you want to trade on within the day. Using this type of indicator together with the Ichimoku clouds forming a single strategy will always provide you with many signals within hours as the reversals shall always occur in the market. These reversals are always identified using the Ichimoku cloud or the RSI and in confluence will give a better signal.
The strategy also provides a means to discover entry opportunities in both bullish trend and bearish as well as in a ranging market. The advantage of easily adding an indicator to this strategy will enhance the profitability of an intraday trader.
This strategy also gives clear signals with a certain level of accuracy such that an intraday trader will find it advantageous. Intraday traders will easily catch pumps by the breakout seen from the Ichimoku clouds and also the RSI trading in the overbought/oversold region.
I will carry out analysis on a price chart using this strategy and place e demo trade for a long position and a demo trade for a sell position. The entry and exit criteria of this strategy is such that when the price breaks the Ichimoku clouds we make an entry depending on the breakout direction. This is also confirmed with the RSI overbought/oversold zones such that the clouds form resistance and support and when broken we have entry opportunities and when another opposite cloud appears, we exit the market.
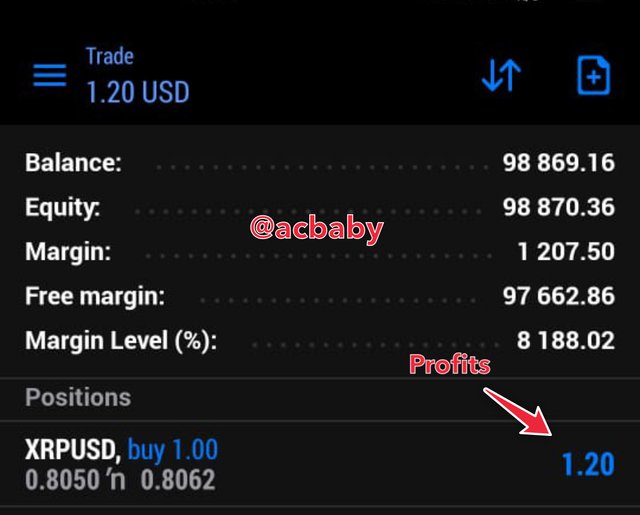
After carrying out the RSI+Ichimoku strategy analysis on the XRPUSD pair in tradingview, I made an entry for a buy trade as seen on the screenshots below.

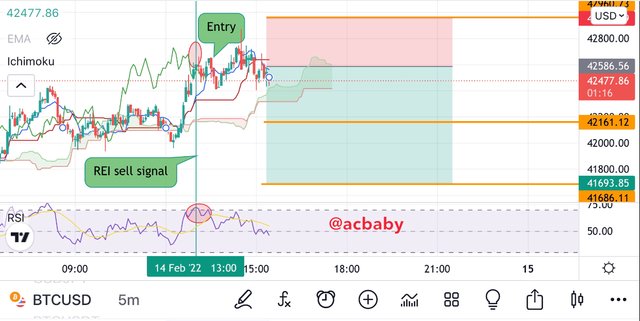
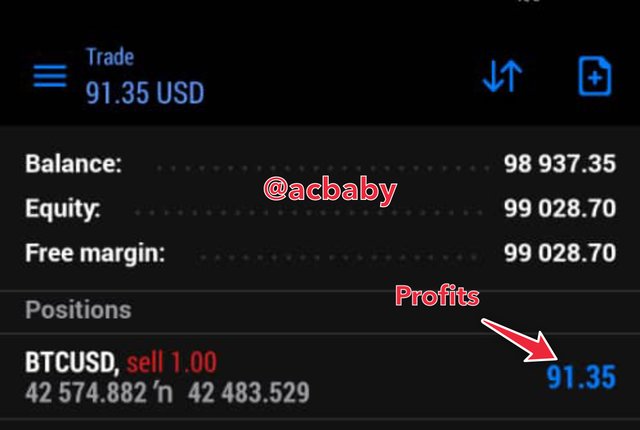
I carried an analysis using the RSI+Ichimoku strategy on the BTCUSD pairs on tradingview platform and then made a Sell trade entry on my demo account. This can be seen on my screenshots below about the trade analysis and results.
**
The RSI+Ichimoku clouds strategy provides a trader with already filtered signals which can enable the trader to have a profitable stay in the market. This strategy can be used together with different indicators such as the different Moving Averages. To spot the support and resistance levels on a chart using this technique is not limited to uptrend or downtrend but also can be used in a ranging market such that entry opportunities are made available for the trader. This is an advantageous trading strategy to a long term trader and a margin trader for intraday trading.
Thanks to my professor for this wonderful lesson which has taught us a lot and added more to the trading knowledge I had.