[Trading strategy with RSI and ICHIMOKU]- Steemit Crypto Academy- Homework post for Professor @abdu.navi03 by @nackasnelson

This task is about a trading strategy made up of the Relatove Strength Index indicator and the Ichimoku cloud indicator. Here I will describe how these indicators can be used in confluence to man up a good trading analysis such that it can keep a trader in profits for his/her stay in the trader space or profession. It has been subdivided into questions as given by my professor and I will answer them with the aid of some screenshots where necessary. Let’s hit the road with the actual work.
The Ichimoku cloud indicator and the RSI indicator are both trading tools that are easy to read. This act like other normal indicators even though the RSI gives only signals after the price had already surfaced but the Ichimoku gives signal before it takes place. In the trading platforms, there are a variety of different indicators which are used for different analytical methods but for the purpose of making a better trading analysis. Some have specifications on when and where they can best fit in while others don’t have preference for time frame or type of market. Examples of indicators are the RSI, EMA, SMA, MACD, stochastic oscillator, CCI and more.
To make technical analysis easy, most traders prefer to use less number of indicators as well as non complex indicators for their analysis. This way they can make analysis without being skeptical about the way they handled the calculations. Even though this analytical tools pro close traders with great results, they can still be faulty. Therefore using the Ichimoku cloud indicator alone can provide false signals as well as false signals can be given by the RSI indicator. To avoid this traders use another indicator as a filter for the other. Therefore we use the RSI indicator as filter for the Ichimoku cloud indicator and the reverse is true.
For the RSI indicator, is one that is made up of a range from 00-100 such that there’s a zone of buying pressure and a zone for selling pressure. This range has been divided into two section: the 50-100 is the upper part which from 80+ we have an overbought area while from 20 below we have an oversold area. When price trades in the overbought area we have a drop in the buying pressure which signifies a possible trend reversal and a gradual increase in selling pressure. If the price trades in the oversold area we have high selling pressure at the peak meaning there’s a possibility of the buyers to start taking over gradually from the sellers. In the last case we have a buy signal.
For the Ichimoku cloud indicator, we can identify trends and how the resistance level and support levels within the indicator is being broken severally. This indicator forms a chart bound feature which generates green and red clouds that stands for the support and resist levels on the chart. This will be explained vividly with screenshots on the following sections.
The combination of these indicators forms a wonderful strategy. The RSI is good at meeting the requirements for a ranging market in terms of the support and resistance levels while the Ichimoku cloud indicator does it for a direct trending market. The Ichimoku clouds keep the price in a range in the vertical axis of the chart such that the price oscillates wishin the Ichimoku indicator. The signal points are found within the Ichimoku clouds and breakouts from its resistance and support levels are confirmed by the RSI overbought/oversold regions.
Like I said above, indicators are a vital component for trading analysis but they tend to be faulty sometimes and to solve this problem, traders use more than one indicator. Below o will describe the flaws of the RSI and Ichimoku cloud indicator when they are used separately.
The RSI is an indicator that is mostly used to understand trends in a ranging market such that there’s a series of up and down fluctuation of price just within a range. This therefore makes the indicator limited in a very strong trending market because the signals might not be valid.
This indicator gives a signal based on past movements in the market not predicting future market moves directly and this makes the signal incomplete to a trader since it only tells you there buying or selling pressure regression or progress in the market but doesn’t tell you if that’s what is coming accurately.
Information or signal from the RSI indicator is mostly considered a preliminary for studying such that the must be another indicator to agree with the signal before it is considered correct.
The RSI indicator provides information about the buying and selling pressure in the market but doesn’t tell the trader about the volume to which this happens. This therefore leaves the trader in the dark.
The RSI indicator is also considered inaccurate when dealing with a strong trending market such as a good bull run. This is because small retracements will be seen as oversold instead of just minimal movement from the overbought region to the center of neutral but/sell pressure.
Signals from the RSI indicator can also take long waiting periods to surface. This means that the RSI can trade in the oversold but the market remains in the overbought such that if any buy positions were placed, there will be much liquidity before the response of the market to the RSI signal.
Sometimes the price doesn’t need to move totally to the overbought or oversold zone before a reversal takes place. This makes a trader lose trading opportunities despite using an indicator for that.
Using the Ichimoku cloud indicator alone for trading analysis may render your analysis to have some false signals. The Ichimoku indicator when used alone can be faulty in the following ways.
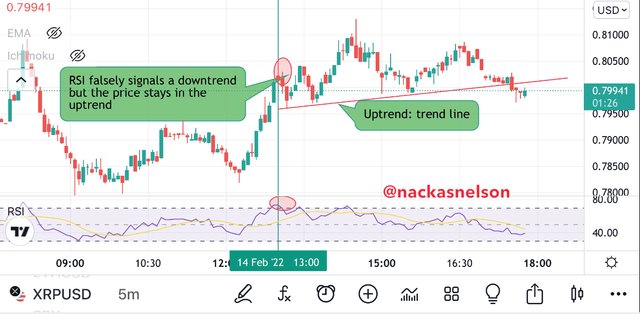
Despite the advantage that the Ichimoku indicator moves ahead of the chart, it has been known to provide false signals. Sometimes the resistance cloud and the support clouds are bridged and the price trades against these areas. We know that if a price sees a resistance or support level it is expected to bounce off unless the trend becomes weak such that a breakout is made.
The interpretation of the signals from the Ichimoku indicator are based on past price history with the Ichimoku clouds but in real time, the past doesn’t actively repeat all the time on the chart.
Applying the RSI and Ichimoku indicator simultaneously will render the results successful most of the time. Since one indicator filters the false signals from the other such that until both indicators provide or agree on a particular market move before the signal will be considered valid.
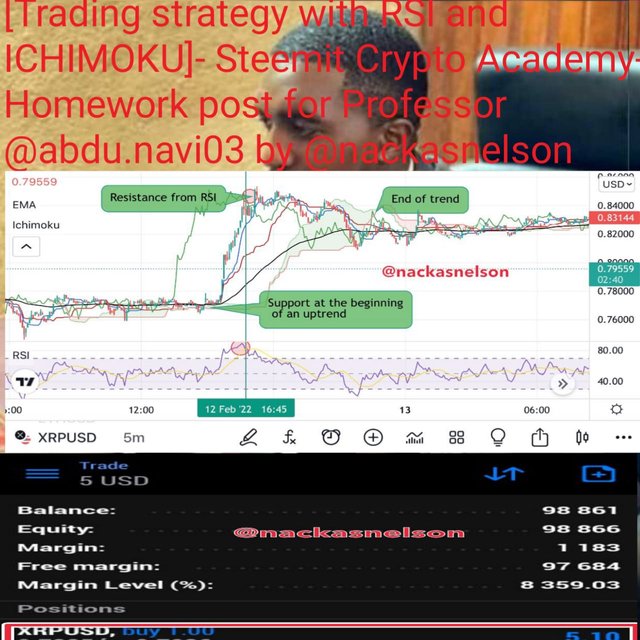
Analyzing price charts for trend identification is a vital part of cryptocurrency trading analysis. The RSI and Ichimoku indicator used in confluence to understand the price trend of a particular asset will provide great results since both indicators are known to complement each other upon trend identification.
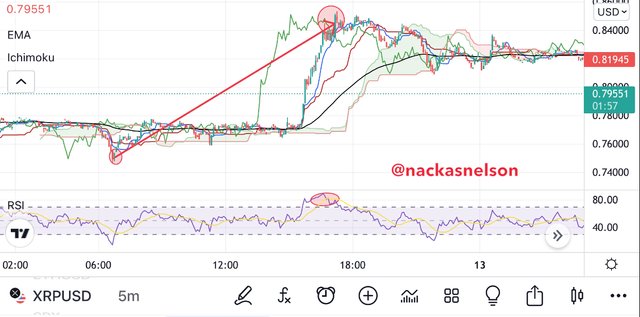
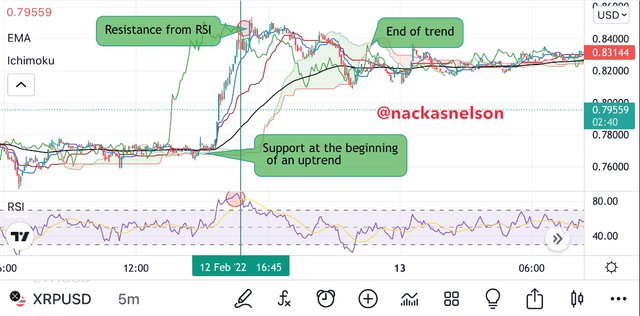
We know that the price is in an uptrend when the RSI indicator trades most of the time within the range of the 50 to 80+ level such that oversold zones are not met quite often. When this is taking place, we check if the price is trading above the Ichimoku clouds or below. If the price trades above the Ichimoku green clouds therefore we are in an uptrend market.

For a down trend, we check if the RSI is trading below the 50 levels most of the time and reaching the below 20 oversold area most often. Therefore I’m such situations we are in a downtrend market and the price on the chart should be trading below the Ichimoku red clouds. The beginning of a downtrend can be seen from when the RSI is spotted to be in the 80+ overbought area and later trades below into the oversold area.
In a ranging market we mostly use the RSI to understand the trend. When the RSI line is seen to visit the overbought zone just as much as it visits the oversold region, we can consider a ranging market in progress. I’m such a case we can see the Ichimoku indicator frequently breaking the support and resistance or staying between the support and resistance levels.
The Moving Averages are indicators that have been known to be compatible with many different indicators upon carrying out technical analysis. There’s no difference with the application of the Moving Average indicator with this strategy.
The moving average indicators are compatible with this strategy so I’m this case I will explain how we can use the Exponential moving average to support or give more credit to this strategy. I will apply a 85-period EMA to the chart containing the Ichimoku and REI indicators.
For trend identification, the EMA above the price means that the price is trading in a downtrend and when the price is above the EMA we say we are on a bullish trend. The further the price trades below/above the EMA is the stronger the momentum of the trend. Therefore I’m a ranging market we will have the price moving in very close ties with the EMA and crossing above and below in different moments such that it forms a range.
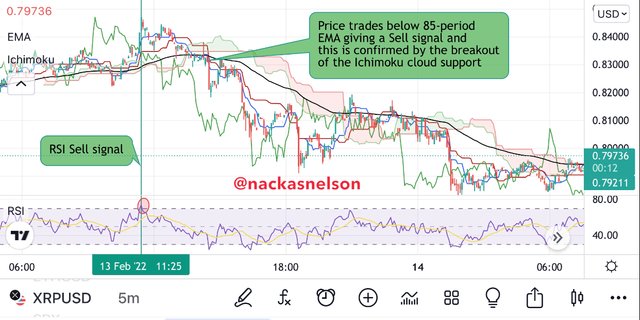
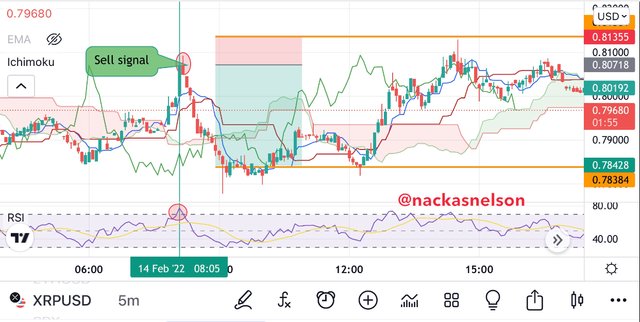
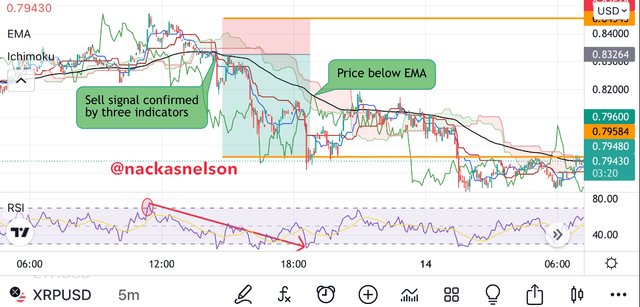
As seen from the screenshot above we can understand how the three indicators can agree to a particular entry point such that they move in confluence. Generally, we place a sell order when the price just crossed the EMA and trading downward. When the EMA gives such a signal we have to check if the RSI is in the overbought region and if the price also trades below the Ichimoku clouds. This way we can say we have a valid sell signal. The same way goes for a buy order just in the reverse manner as the sell order.

We should know that the EMA at 85-period can be changed to a different period depending on the traders preferred time frame for the analysis.
When price trades and stays (maintaining a certain high or low) at a particular price for some time, it forms a chain which we can call support (in the case of lows) or resistance (in the case of highs). Cryptocurrency trading technical analysis infer information from such strong levels of the price chart. This is because the breakout of such levels will lead to a greater opportunity to dive into the market.
tay
Like I said, the Ichimoku indicator is best to describe support and resistance levels such that they are separated into green and red clouds. The Ichimoku indicator is very good for trend identification from the breakout of the support or resistance. Notwithstanding, the Ichimoku is only that good for a strongly trending market but limited in identifying such situations in a ranging market. That is where the RSI indicator comes into play. The RSI indicator is best in identifying support and resistance in a ranging market.
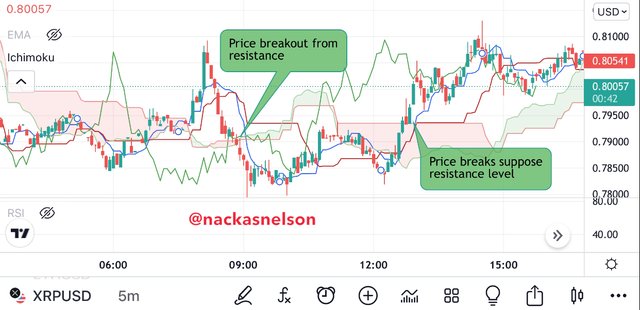
When the red cloud on the Ichimoku indicator appears on the price chart we know that we have a resistance level such that the price may likely trade below this point unless it breaks the resistance for higher highs to be formed. On the other hand, when the price trades above a green cloud we know that we have a support level set. If the support is broken, we know that there’s an entry opportunity in the market for the formation of lower lows.
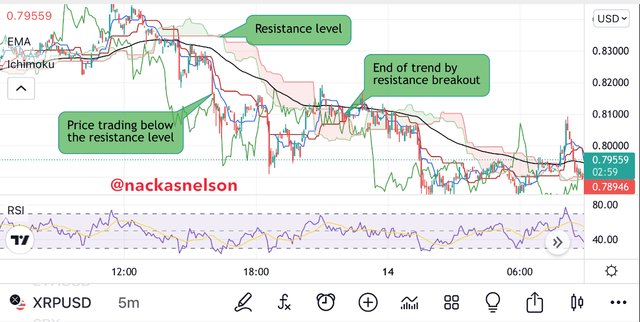
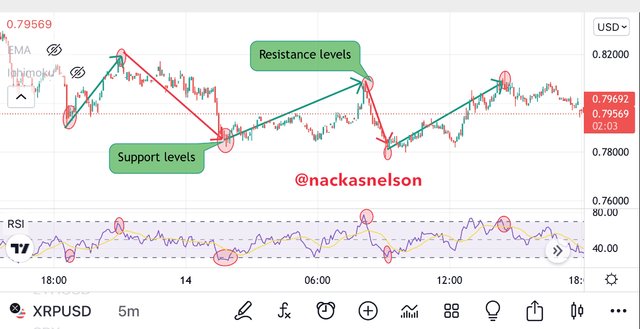
The above screenshot shows how the support and resistance levels appear on this strategy. This situation is best for a strongly trending market.
When we have a ranging market, the Ichimoku indicator can be faulty and in such situations we use mostly the RSI indicator for support and resistance levels identification. When we see the price trading in the overbought region of the RSI we know that we have a possible resistance level from which the price may likely bounce back to the downside. For the support levels, the RSI has to trade in the below 20 level (oversold) such that a possible support is formed. When this happens there is the possibility of the asset rejecting that low price and turning to the upside for an uptrend due to reduced selling pressure as the selling pressure meets its peak.
In cryptocurrency trading technical analysis, any strategy having more than a single analytical tool is worth using. The RSI+Ichimoku indicator strategy is a good strategy for intraday trading because it is first of all applicable to all time frames. Where the is an opportunity in the market to make good entry positions, the RSI+Ichimoku indicator strategy will readily reveal such opportunities to the trader within minutes or hours.
Whenever the RSI indicator is lagging, the Ichimoku indicator settles by filtering the fasle signal such that they must act in perfect confluence to give a particular signal. With this strategy an intraday trader can get multiple reversal signals for good entries within hours in a day.
The oscillation of the RSI provides several possible buy and sell opportunities even in a ranging market and when in a strongly trending market the Ichimoku indicator will readily provide good signals to the trader.
An intraday trader also has the opportunity to add other profitable simple indicators such as the moving average indicators. When there’s an impulsive move in the market, it’s very probable that it shall be signaled by the RSI+Ichimoku indicator.
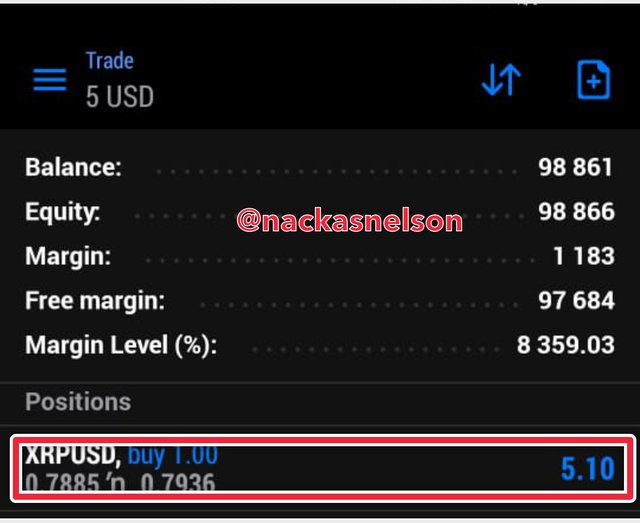
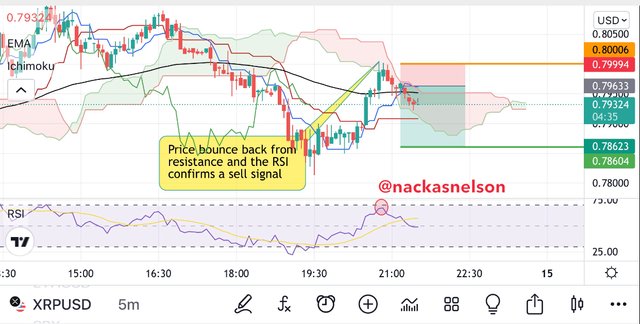
After carrying out technical analysis using the RSI+Ichimoku indicator strategy, I will place a buy and sell order for different cryptocurrency pairs. When the price breaks the Ichimoku cloud we make an entry depending on the direction we place a buy/sell order. This has to be confirmed by the overbought/oversold zone so that the signal is made valid by confluence of both indicators.
 <screenshot from Tradingview.com

Trading the cryptocurrency market requires that one be very keen to the kind of analysis applied to understand entry opportunities in the market. Applying a technical analysis strategy requires that traders use more than one indicator so that they can avoid fasle signal. Irrespective of the profitability of the utility of signal tools, they can still be faulty when applied individually. The RSI+Ichimoku indicator strategy plays a good role in a successful trading journey. This analytical strategy helps traders to cancel out false signal from individual indicator. This strategy is very compatible with other indicators such as the moving averages. Getting a particular signal from more than one indicator makes a trading signal to be very valid. This helps the trader to make good entry into profit making positions.
Thanks for reading.