TRADING STRATEGY WITH RSI AND ICHIMOKU | STEEMIT CRYPTO ACADEMY | HOMEWORK POST FOR PROFESSOR @abdu.navi03
Good day steemians, I want to welcome everyone to week 2 the Academy season 6. This is my homework post on the topic 'Trading Strategy With RSI and Ichimoku' as taught by professor @abdu.navi03.
.jpg)
IMAGE DESIGNED ON POSTERMYWALL.COM
1-Put your understanding into words about the RSI+ichimoku strategy
2-Explain the flaws of RSI and Ichimoku cloud when worked individually
3-Explain trend identification by using this strategy (screenshots are required)
4-Explain the usage of MA with this strategy and what lengths can be good regarding this strategy (screenshots required)
5-Explain support and resistance with this strategy (screenshots required)
6-In your opinion, can this strategy be a good strategy for intraday traders?
7-Open two demo trades, one of buying and another one of selling, by using this strategy

The Relative Strength Index also known as the RSI and the Ichimoku indicator are among some of the top-rated indicators traders use to execute trades. This two indicators can be combined to form a trading confluence and we can use their combination to effectively make profitable trading decisions.
As far as technical analysis is concerned, we can use the RSI which is primarily a momentum indicator to evaluate price movement or changes. This indicator which was developed by J.welles basically appear as a line graph that oscillates between two end points. It consist of a reading scale of 0 to 100. When the price of an asset is reading above 70 on the RSI indicator, this means that such asset is in an overbought condition and if the asset price is reading below 30, it indicates that the asset has been oversold.
Similarly, the Ichimoku cloud indicator is another potent indicator used for technical analysis, this indicator helps to identify support and resistance levels and it also helps to identify price trends. However, during a Bullish trend, the top of the cloud moves up and likewise during a downtrend, the bottom of the cloud moves down. This indicator which was developed by Goichi Hosoda helps to provide key information about the market by using moving averages. When this Ichimoku is used together with the RSI indicator, a trader can easily spot price momentum in a trend or particular direction.
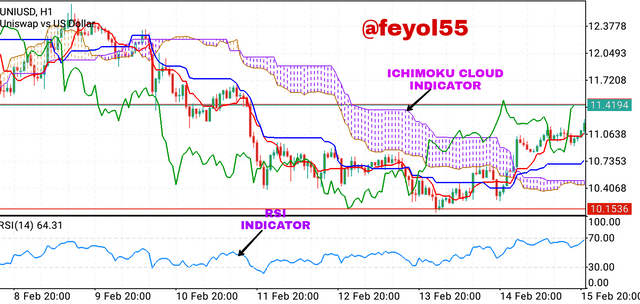
The image below shows the RSI and Ichimoku cloud indicator on a market chart.
Despite the relevance of this two indicator, they both have their shortcomings especially when used individually. I will be discussing some of these flaws below.
FLAWS OF THE RSI
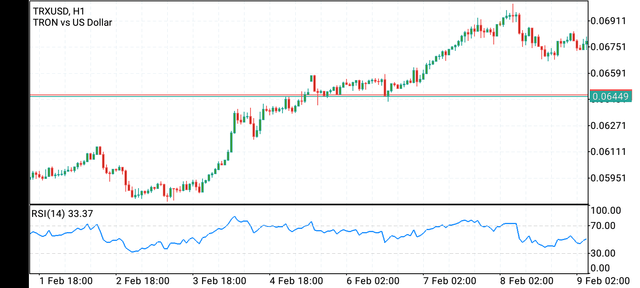
The RSI which is a momentum base indicator as discussed earlier can be used to confirm the buying and selling positions of the market on the scale reading of 0 to 100. Using this scale, we are able to know who is currently in control of the market. However, this indicator can easily flop when the market is trending, the RSI sometimes doesn't give the real picture of the strength of the buyers or sellers when prices have been overbought or oversold. For example, when there is a strong bullish trend, the RSI reads above the 70 scale indicating an overbought market, it might sometimes fail to come down and the traders will be confused on how long the trend may last. Meanwhile, the bullish trend may keep running for as long as possible while the traders who rushed to place a sell entry at the overbought region will be liquidated. This explanation is further buttressed by the chart below.
Another shortcoming of the RSI is that it doesn't indicate the precise and accurate volume that is entering the market.
FLAWS OF THE ICHIMOKU CLOUD
This indicator basically consist of 5 different moving average lines that forms a cloud-like structure which helps to forecast possible support and resistance on the trading chart. However, the Ichimoku has its own flaws as well when used individually. Firstly, due to the numerous lines that forms this indicator, the chart looks more busy and noisy and this can pose a problem to some traders.
Another major flaw of the ichimoku cloud is that it lags behind price momentum. The indicator is sometime slow to detect movement or shift in price at times as a result of this, the indicator will give a signal which is already behind the market hence a trader who fall into this trap might be getting it all wrong if care isn't taken.
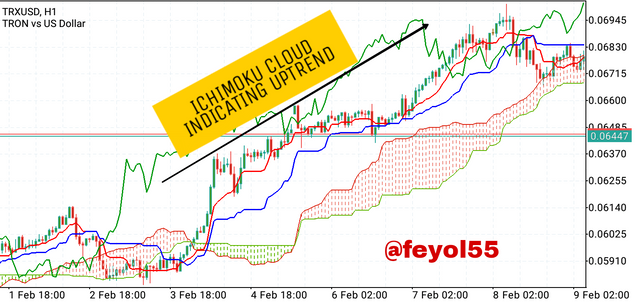
The Bullish or Bearish trend can be identified using the combination of RSI and Ichimoku strategy. Let's take a look at how this indicator can help identify an uptrend and downtrend.
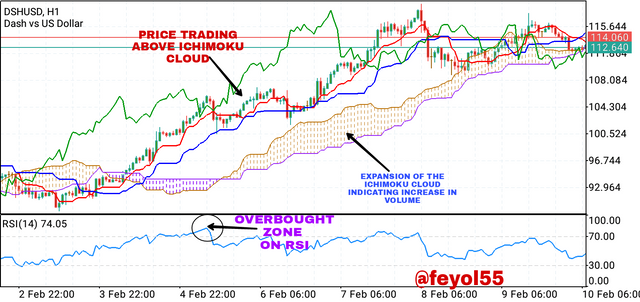
This is the DSH/USD market chart above, when we check the RSI Indicator, we will notice the RSI is reading is above 70 meaning the market price is in overbought condition. This interpretation can be seen clearly on the chart as price is going uptrend forming higher highs and higher low. Now, let's check the ichimoku cloud as well to confirm the bullish trend, it is important to know that when price is trading above the Ichimoku cloud, that signals an uptrend movement of price and when we check this chart, we can clearly see the price trading above the Ichimoku. In addition, the bullish momentum can be observed on the expansion of the ichimoku cloud as seen on the chart which indicates high buying volume. Now let's take a look at how to identify a downtrend using this strategy.
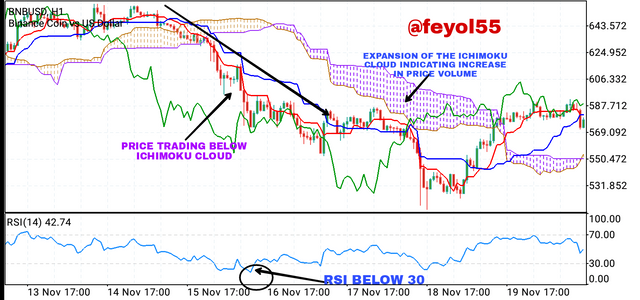
This is the BNB/USD market chart above when we check the RSI indicator, we will notice that the RSI is reading below 30 meaning the market price is in oversold condition. This interpretation can be seen clearly in the chart as we can observe that price is going downtrend forming lower lows and lower highs. To further confirm this trend, we need to check the Ichimoku cloud. We can also see on the Ichimoku indicator that the price is trading below the Ichimoku cloud. We also see the expansion of the Ichimoku cloud indicating increase in the volume of the sellers. This further confirm the bearish trend as seen on the chart.
As learnt in this study, I'm going to use the 85 MA to analyse the market in confluence with the RSI + Ichimoku strategy.
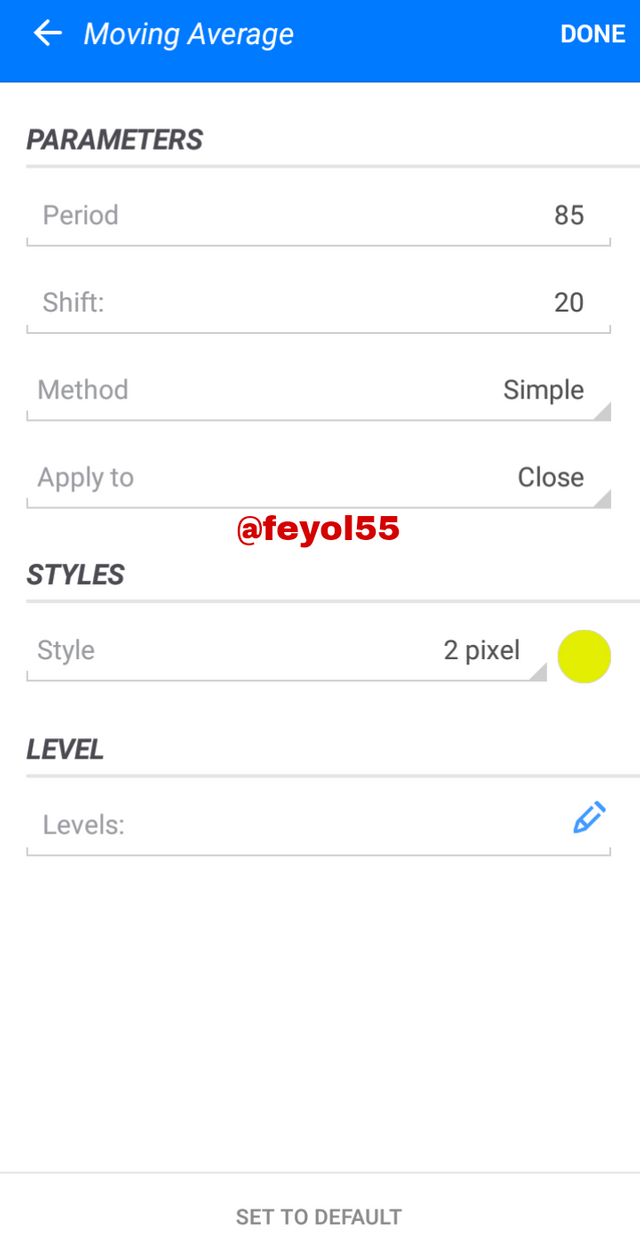
This is the setting for the MA
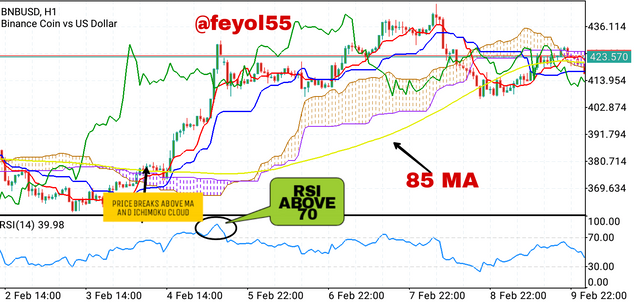
As seen on the BNB/USD market chart above, the yellow line indicates our MA and we can clearly see that price is trading above it. The price cuts from below and traded above the MA line as well as the Ichimoku indicator. Furthermore, the RSI is clearly reading above 70, this means all the three indicators used here are in confluence together signalling a bullish trend.
Support and resistance areas are key important zones on the trading chart. They help the trader to identify potential buying or selling areas in the market chart. The Ichimoku cloud indicator can be used to identify this zones when the market is in trend (either Bullish or Bearish). Let's take a look at the chart below which further explains this.
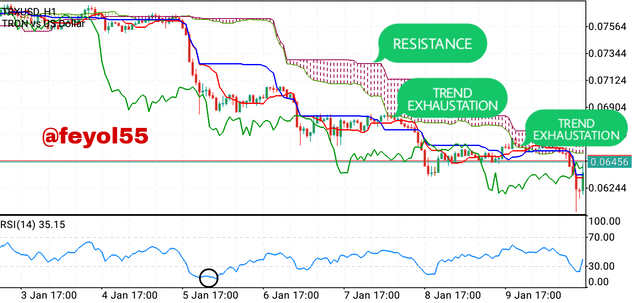
When the market is in a downtrend, the Ichimoku usually serves as the resistance on the chart and when the price nears the cloud and breaks it, it indicates that the trend is over. In this case the Ichimoku cloud usually appears red in colour.
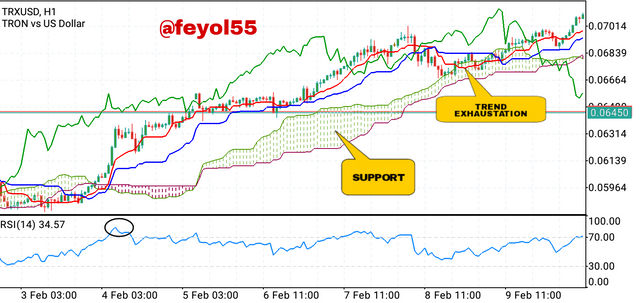
When the market is in uptrend, the Ichimoku cloud serves as the support and it appears in green. However, when price nears the cloud and breaks it, it is also an indication that the trend is over.
Now that we've been able to identify the support and resistance zones using Ichimoku when the market is in trend, let's also look at how to identify the support resistance zones when the market is in sideways. To identify this area, the RSI indicator will be used as it can do the job better in a sideway market than the Ichimoku cloud indicator.
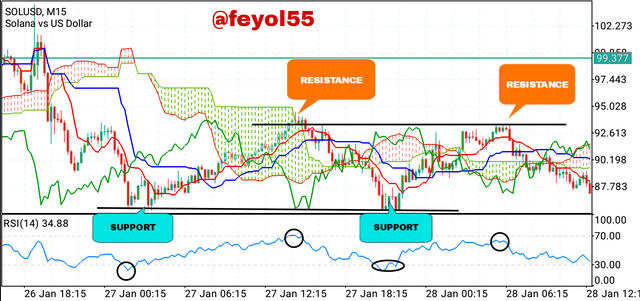
As seen on the SOL/USD market chart above, we were able to identify the support and resistance level on this chart using the RSI indicator. When the market is moving sideways, the overbought and oversold area serves as the resistance and support zones respectively. However a trader can use the 60-40 reading scale here to confirm the zones. It means if the price is reading above 60, it indicates a resistance point and if it's below 40, it indicates a support area.
The combination of the RSI and Ichimoku cloud is a perfect analytic tool for intraday traders. The low length moving averages being used by the Ichimoku indicator makes it suitable for trading intraday. Likewise, using the combination of this two indicators, the trader can spot trends, support and resistance areas, potential entry and exit points in the market. Also, when used with MA, an intraday trader can further confirm his entry position and maximize profit from it.
I will be demonstrating this strategy in demo account by taking a buy and sell entry position on the MT5 trading platform.
BUY ENTRY ON FIL/USD MARKET CHART
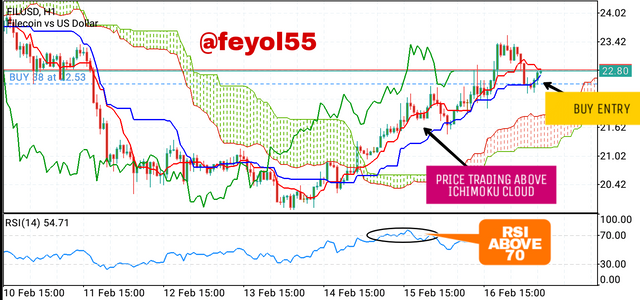
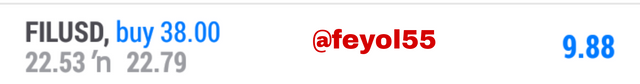
On the FIL/USD market chart above. I observed that the RSI was on an overbought region which means the buyers are active and there is a buying pressure. To further confirm this, i also observed on the Ichimoku cloud and as seen above the price broke the cloud and traded above it which indicates a Bullish reversal. After I confirmed this, I placed a BUY ENTRY as seen on the chart above. Below is the profit I made from the trade.
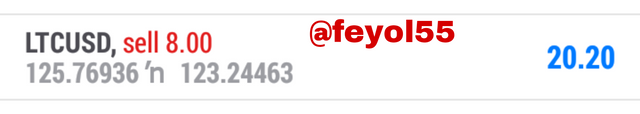
SELL ENTRY ON LTC/USD MARKET CHART
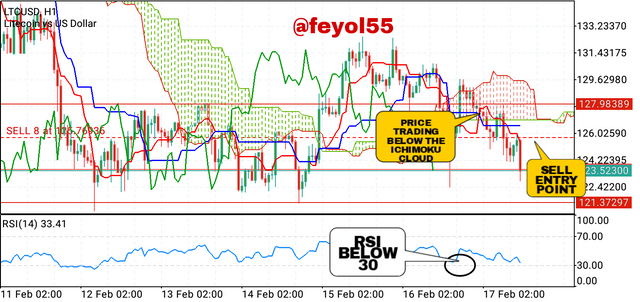
Looking at the LTC/USDmarket chart above, I did observe that the RSI was trending below the 30 scale indicating an oversold region, this means the sellers are active and there is a selling pressure. To further confirm this, I also checked the Ichimoku cloud and saw that the price broke below the cloud and traded below it which indicates a bearish reversal. After I confirmed this, I went ahead to place a SELL ENTRY Below is the profit I made from the trade.
This study has enlighten us on the strategic combination of the RSI and Ichimoku cloud to execute trades. However, it should also be noted that when these two indicators are used together, they can help filter out false signals as well which helps in getting a more accurate result. But when used individually, there are some shortcomings of the indicator that could affect trading decision and the trader may end up making a wrong entry.
However, I've learnt from this study how I can effectively combine these two indicators together to identify entry and exit points both in trend and sideway trend.
Special thanks to professor @abdu.navi03 for this wonderful course.