A Disappointing Optimization

This was originally going to be a post about the upcoming optimizations in Gridcoin. It was going to show how much faster the Camilla release will be compared to Betsy, complete with grandiose benchmarks showing that all our chain synchronization speeds would be solved and that running on a Pi would be a breeze. Sometimes you overhype and things don't go as planned.
Benchmarking
In order to see how much faster we are now I chose to import the latest chain snapshot using -loadblock. This eliminates the network fluctuations and allows me to focus on the raw processing performance. The tests were done on two identical, somewhat slow computers:
- Core2Duo 2.66GHz
- 4GB RAM
- 7200 RPM HDD
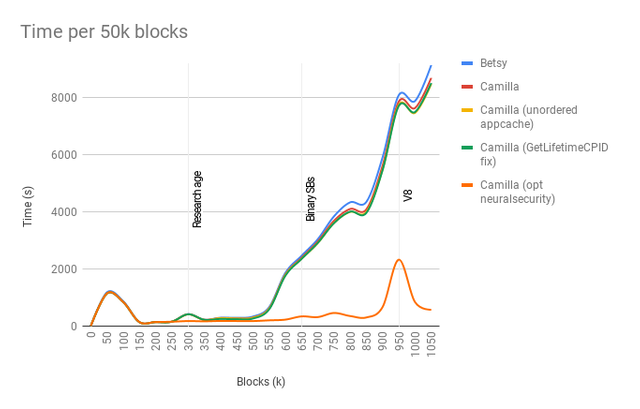
I added output information to plot the total time spent at every 50k blocks imported, launched Betsy (staging) and Camilla (development) and let them run the import.
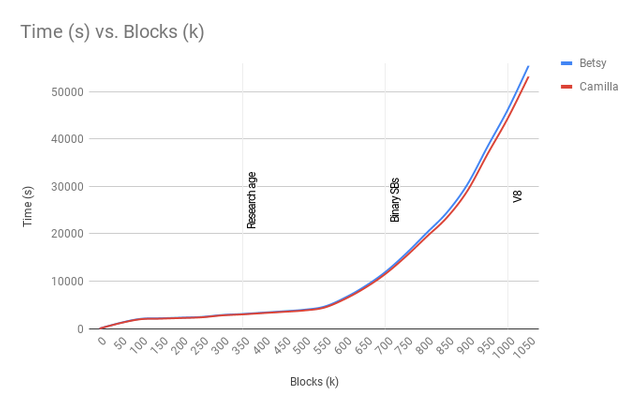
Wait, what? This is mind blowing but in the bad way. With the optimizations done Camilla should have been the holy graal of chain syncs. It imports 1050k blocks around 45 minutes faster than Betsy which is nowhere near my expectations. The benchmark did however reveal one very important thing which was new to me: Block synchronization slows down over time. This becomes apparent when you plot the time it took to import each 50k block chunk.
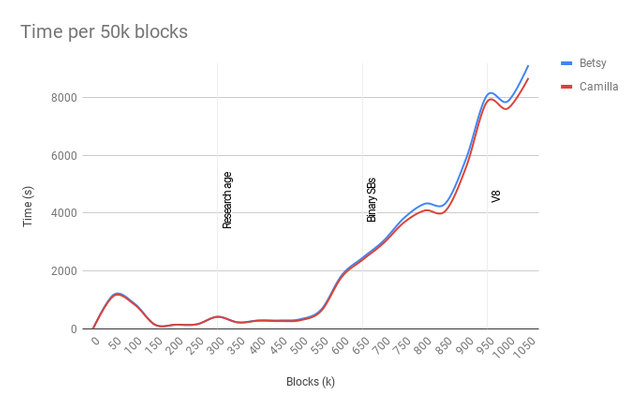
This shows a severe scaling issue and this most likely gets progressively worse. It might even explain why some people are having issues syncing, though that is just a guess.
Investigations
The behavior indicates one of two things:
- We are using containers which do not scale well.
- We have loops which increase in range over time.
Neither really fits the graph as I would expect a more linear or consistent increase in times and certainly not a decrease as we see in the ranges 800-850k and 950k-1000k, but taking a deeper look at the containers and loop is some sort of a starting point.
The best way to approach this is usually to profile a run to pin point where the CPU cycles go. Unfortunately, Valgrind's Callgrind is far too slow to sync up enough for the problem to show and gprof does not show anything in this case. For example, in this 6h+ run it claims that scrypt used most of the CPU cycles.
Each sample counts as 0.01 seconds.
  %   cumulative   self              self     total
 time   seconds   seconds    calls  Ks/call  Ks/call  name
 37.40   1188.46  1188.46  4086906     0.00     0.00  scrypt_nosalt(void const*, unsigned long, void*)
Since it samples at regular intervals it tends to miss things which are small but done frequently. This is a hint that the problem might lie in how we access container data. We just have to this manually.
Containers
The two most frequently containers accessed or modified are the ones which hold the block indices and the application cache. The block index map was recently changed from a sorted map to std::unordered_map. This container is faster on access if you can generate cheap hashes, which we can, but maybe it does not scale as well. Since both Core2Duo computers were busy testing other solutions I ran a quick test on my workstation where I switched the container back to std::map and saw the exact same time graph, only with reduced times.
The second test was to switch the application cache to using unordered_map as well.
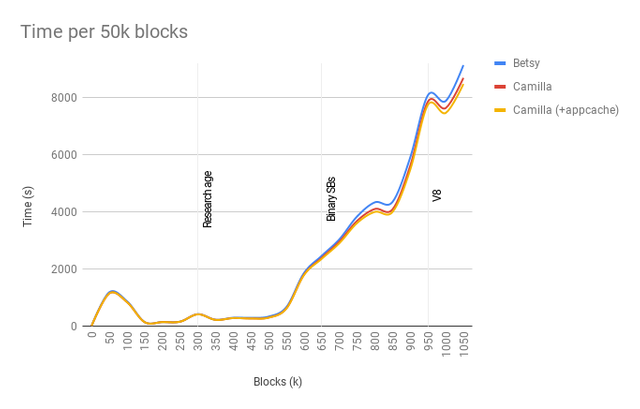
Ok. An improvement to the overall speed of the application but it has the same problem as before.
Escalating loops
Most of the loops either have such a small range for them to be significant, or they have a long but constant range. One loop which stands out is the tally loop in GetLifetimeCPID. What the loop does is to go through each block staked by a certain CPID and collect statistics such as interest and PoR collected, total magnitude and stake times. This is done for every connected PoR block which definitely would count as an escalating loop. The longer the chain the more blocks staked and the more blocks have to be iterated over.
We still need to be able to do this when disconnecting blocks but when connecting blocks we can focus on just tallying those particular block(s) on top of the previous tally numbers. It scales better and performs better.
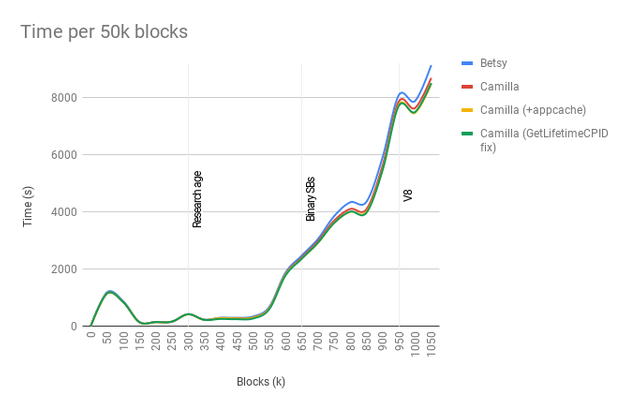
Again, a tiny bit faster, still slow overall.
Monitoring appcache
Let's go back to the application cache to see when and with what it gets populated during a chain sync.
| Height | beacons | altbeacons | currentneuralsecurity |
|---|---|---|---|
| 0 | 0 | 0 | 0 |
| 50k | 0 | 0 | 0 |
| 100k | 0 | 0 | 0 |
| 150k | 0 | 0 | 0 |
| 200k | 0 | 0 | 0 |
| 250k | 1 | 1 | 0 |
| 300k | 2 | 2 | 0 |
| 350k | 4 | 4 | 0 |
| 400k | 668 | 765 | 0 |
| 450k | 1138 | 1324 | 0 |
| 500k | 1512 | 1744 | 0 |
| 550k | 2219 | 2532 | 785 |
| 600k | 2448 | 3010 | 1093 |
Now we are getting somewhere. The slowdowns start at 500k and really ramps up after 550k. This coincides with both the altbeacons and the neural security hash count. Let's have a look at where these entries are used to see if there's a connection.
The neural security entries stem from the ComputeNeuralNetworkSupermajorityHashes function which gathers all the superblock votes cast by the stakers. The function also populates additional data structures with the collected votes. To begin with these structures are ordered maps and we most often do not care about the ordering, so converting them to unordered_map and adding ordering code where needed improves the performance. There are also some odd and very slow constructs when inserting or modifying container data:
if (mvCurrentNeuralNetworkHash.size() > 0)
    temp_hashcount = mvCurrentNeuralNetworkHash[NeuralHash];

// ...

if (temp_hashcount == 0)
    mvCurrentNeuralNetworkHash.insert(map<std::string,double>::value_type(NeuralHash,0));

// ...

temp_hashcount += votes;
mvCurrentNeuralNetworkHash[NeuralHash] = temp_hashcount;
These types of checks are both redundant and extremely inefficient. For each time this code is run it has to do three map lookups using the same key. All of this can be replaced with:
mvCurrentNeuralNetworkHash[NeuralHash] += votes;
which does one single lookup and inserts a default value of 0 if missing.
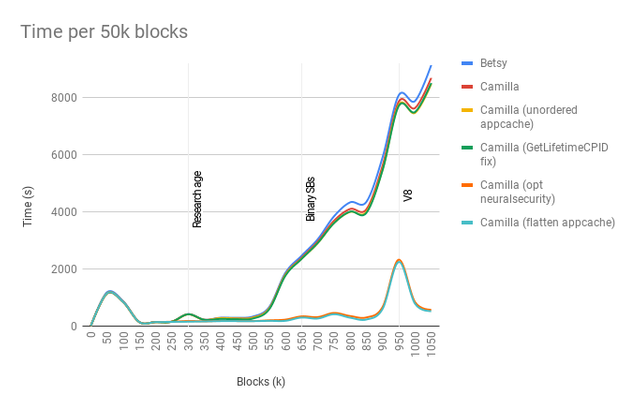
Additionally we keep populating the appcache with "neuralsecurity" entries when we should clear them before collecting new ones. Without such a clear it will keep growing until the rules change in v9.
There we go! Now we actually have an acceptable and consistent block acceptance perfomance. The process is still quite slow at reorganizing which might explain the v8 bump. When importing a snapshot it seems to still process the blocks as they arrived which would explain why there were a lot of reorgs around the v8 switch. We can work on that and improve the reorg performance.
Revisiting appcache
At this point we could start wrapping things up and call it a day. I had one more thing I wanted to test out though, and that was to flatten the application cache which, despite its name, is not a cache but a global key/value store.
The cache is stored as a map of maps. You have the outer map which serves as cache sections. Beacons, projects, polls. That type of grouping. This means that every time you want to access a certain cached item you first have to do an additional lookup just to get to the section which contains the it. Since we know the actual cache sections at compile time we can hard code the caches and have them accessible by an identifier instead of a string. The access is changed from
ReadCache("beacon", cpid);
to
ReadCache(Section::BEACON, cpid);
It's less flexible but faster and type safe.
Nothing spectacular. It saves around 10 minutes on my systems which is better than nothing, I suppose. It's always good to reduce the cost of a key/value store, especially considering how often we access it.
Results
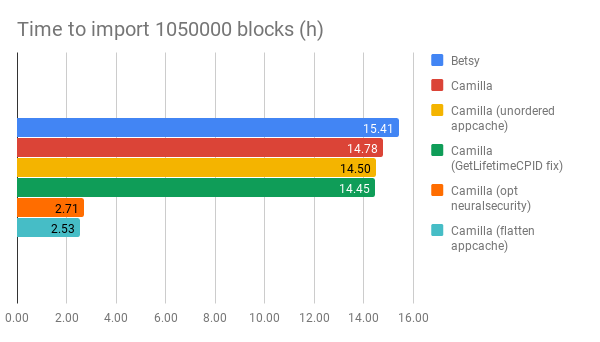
The chain can now be imported and synced at an acceptable speed. We can continue focusing on the reorg speeds but this will do for now.
There are some important lessons to take from all of this:
- Don't fully trust the profiler, especially not if it's a sampling profiler.
- Pick your containers very carefully.
- Use your containers cautiously.
Now I can write that article.
These improvements are just awesome!
I also like the overall "story-style" of this post
Excellent post @ravonn! Keep up the amazing work & these cool posts :D
Great to see such a dramatic reduction in import times! 👍
Worth noting here is that while I only did an import, you are going to see an equal reduction in sync times as well. Syncing 0-1M over the network should be 13h faster when/if the PRs are accepted.
Fantastic summary of all the work you've been doing on optimization ravon! However, this post is not truly complete without the obligatory image of Camilla the Chicken:
Keep up the great work :)
Not so disappointing in the end! :)
To listen to the audio version of this article click on the play image.

Brought to you by @tts. If you find it useful please consider upvoting this reply.
Keep up the great work! The community always appreciates these updates.
Congratulations @ravonn! You have completed the following achievement on Steemit and have been rewarded with new badge(s) :
Click on the badge to view your Board of Honor.
If you no longer want to receive notifications, reply to this comment with the word
STOPCongratulations @ravonn! You have received a personal award!
Click on the badge to view your Board of Honor.
Do not miss the last post from @steemitboard:
You just planted 0.13 tree(s)!
Thanks to @barton26
We have planted already 3346.59 trees
out of 1,000,000
Let's save and restore Abongphen Highland Forest
in Cameroonian village Kedjom-Keku!
Plant trees with @treeplanter and get paid for it!
My Steem Power = 19471.62
Thanks a lot!
@martin.mikes coordinator of @kedjom-keku