GBP/USD Falling Wedge Breakout - The Signs
GBP/USD Key Points
- Higher time frame, GBP/USD bearish trend.
- Price looks to be flattening out as daily support holds for nearly 12 months now.
- With price above higher time frame support, an hourly falling wedge breakout gives us a potential entry.
GBP/USD Technical Analysis
Morning team,
We've had a great week trading, highlighted by yesterday's USD/CAD short profits, so I'm just going to use today's analysis for a chance to look at a setup retrospectively.
I still get a lot of questions on Twitter and email around what I actually look for when entering a trade. Well this GBP/USD setup will help explain my entry triggers, on a semi-live example.
First of all, bring up the daily GBP/USD chart:
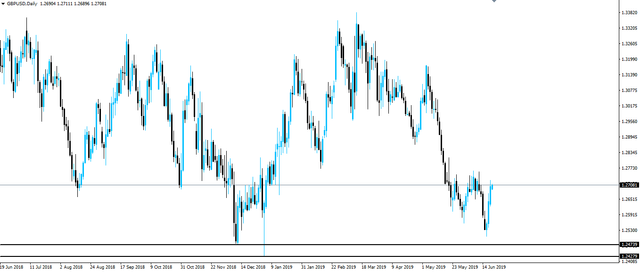
You can see that basically throughout 2018, the general trend has been bearish. You can also see that since about August last year, that price has started to flatten out and a cear daily support zone has formed.
So long as price is above this suport zone, I would rather be buying GBP/USD than selling. The fact that price has clearly bounced again, shown by the last four daily candles being big bullish bodies, gives me further confidence that the level is holding on the higher time frame.
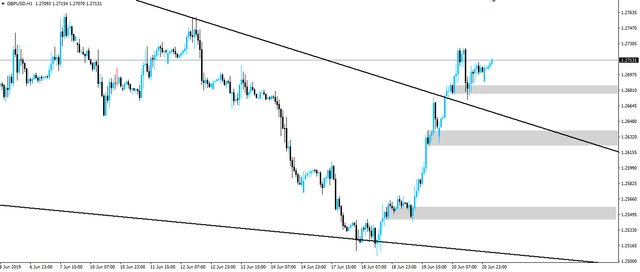
So now we've found the higher time frame direction, lets zoom into an intrday chart. In this case, I've gone with the hourly:
When I say intrday chart, I mean anything below the daily. I personally like the hourly chart the best, simply because it's the most standard. No matter how you look at an hourly candle, it's always the same. H4 candles on the other hand, can look very different, depending on which timezone your broker uses for their servers.
It's not a huge problem and 90% of the time it doesn't really matter, but how candles might be displaying on different charts, is just something to keep in mind.
Zoom out a bit and you can see the huge falling wedge that's formed. The bottom of the wedge also coincides with the bottom on the higher time frame chart where we've only had bullish candles since. Another bullish sign.
In looking for long entries on the intraday chart (because that's the direction the higher time frame chart told us to trade in, remember), the key is being able to keep my stops tight. This means that I don't want to be buying the highs, but instead trying to buy pullbacks.
This is where I search for previous short term resistance levels, that when retested from the other side, often turn to support. These are just simply hourly candles that have closed bearish. Support/resistance is really just a guide and nothing is ever going to be exact, so don't get too worried here.
You can see that I've marked these areas of short term resistance turned support with grey boxes on the chart. Each time that price had come back to retest these zones, they held this time as support and price carried on higher. That is where you want to be looking to enter.
With the falling wedge only just breaking out to the upside today, lets see if this setup still has some legs left in it.
Best of probabilities to you.
Dane.
Upcoming Economic Releases
GBP BOE Gov Carney Speaks
@forexbrokr | Steemit Blog
Market Analyst and Forex Broker.
Join my Inner Circle ⭕️ - www.forexbrokr.com
Congratulations @forexbrokr! You received a personal award!
You can view your badges on your Steem Board and compare to others on the Steem Ranking
Do not miss the last post from @steemitboard:
Vote for @Steemitboard as a witness to get one more award and increased upvotes!