ETHUSD - Technical Analysis October 17, 2017 - Current Price $322

ETHUSD
Hard fork, will travel! We want to look at Ethereum ahead of the fork for possible trading opportunities, in both USD and BTC. The last time we were looking at ETHEREUM, our call was to go bullish above the $310s and she delivered the $340s and we have been waiting for a pullback.
daily
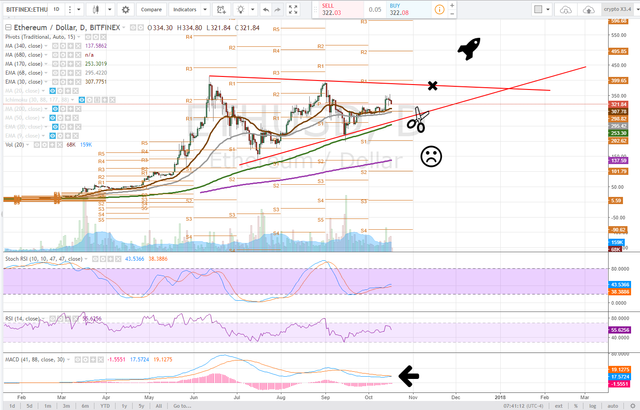
The daily time frame has formed a clear pennant and traders and investors should be looking for a retest of the upper limit, and ideally, a breakout but of course testing the lower trendline is possible.
Note the MACD on this time frame, ready for a bullish cross (something we've been waiting for) and will occur on volume. We need to see demand pick up. Currently, ETH is having a pullback and traders should look for the 30ema (brown line $307) to hold. If this support fails we will test the daily pivot and 68ema, approximately $295.
Notice the stochastic RSI is still trending upwards, though slowly.

4 hour
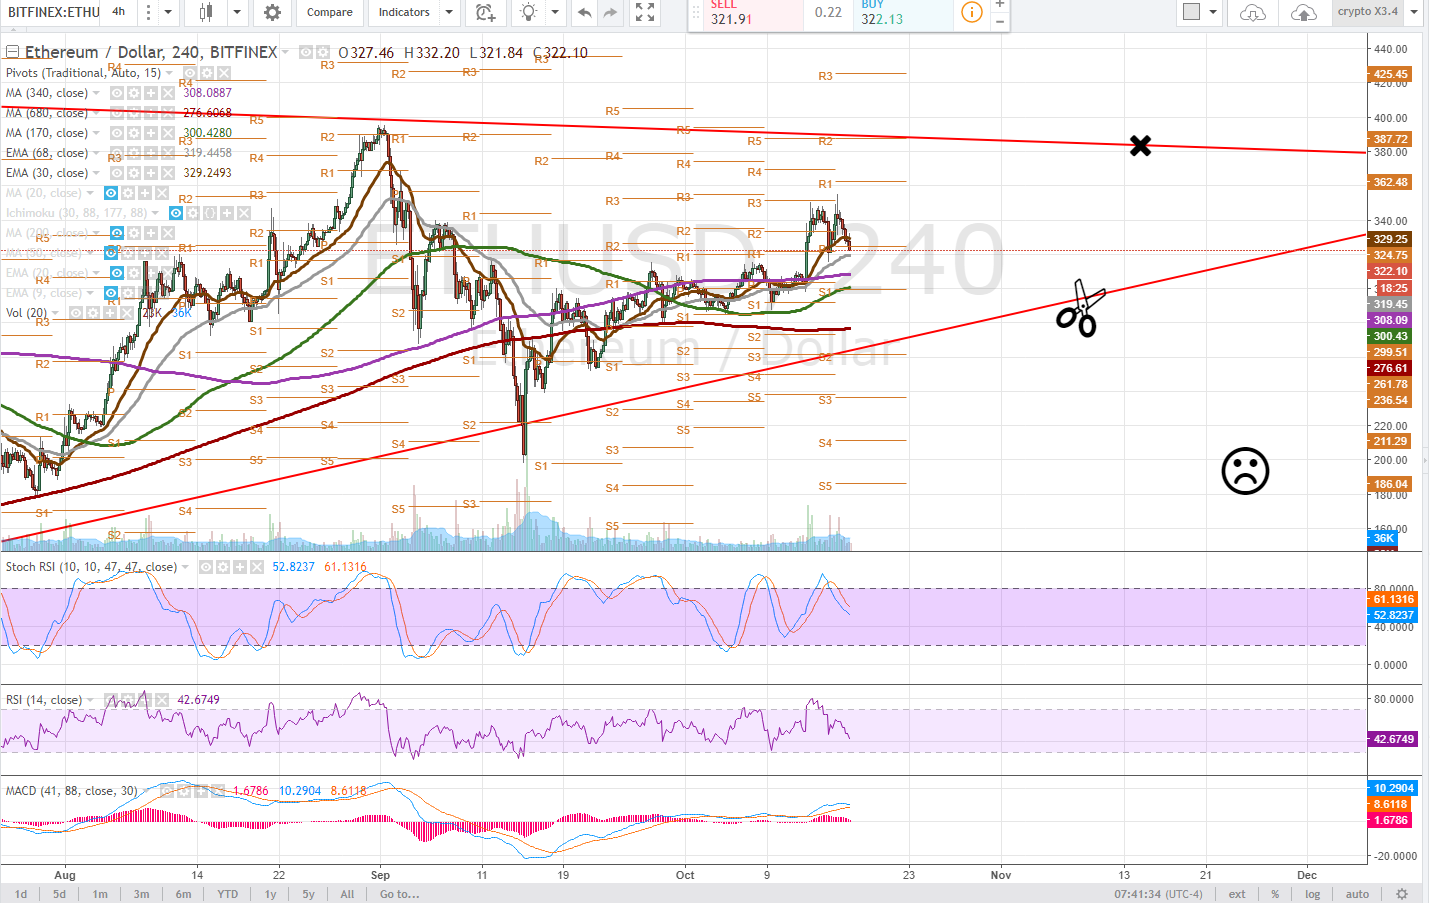
Onthe 4 hour time frame an M top, double top is easily observed as the price has fallen through the pivot on this time frame, we look for the 68ema to act as support approximately $319.
Traders should be cautious of the downtrending RSI, the bearish curl in the MACD which could deliver a bearish divergence in the indicators and as well the stochastic RSI which has fallen out of uptrend. The 4 hour time frame on balance appears bearish.
Not the 170dma (green line) curling upwards and a cross above the 340dma (purple line) would be more conducive to bullish price action.

1 hour
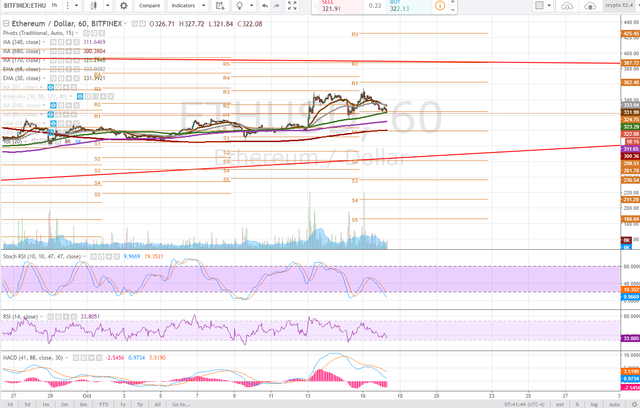
The 1 hour time frame is looking quite a bit better, though the possible double top remains, but support is being found at the 170dma ($323) and should this moving average hold traders will look for the price to reclaim pivot support and consolidate.
The RSI and Stochastic RSI have been downtrending since this top was set and the MACD is headed towards deviation zero. If the price can maintain this level we should see some bullish price action that can produce a bullish MACD and drive the RSI. It is important to note the RSI is approaching oversold, an opportunity to buy a small day trade could present itself if the RSI falls into oversold and then reverses.
If the supports fail to hold on these time frame, expect a test of lower trendline approximately $260.

Bullish Above: $350
Bearish Below: $308
RISK TRADE: Wait for clarity, lean bullish given the software upgrade. Anticipate volatility and scale a long position up to $310. If price looses this level look for the 170dma on the 4 hour to hold, $300. Loosing $300 would be very bearish and we would look to short until trendline, and go long.
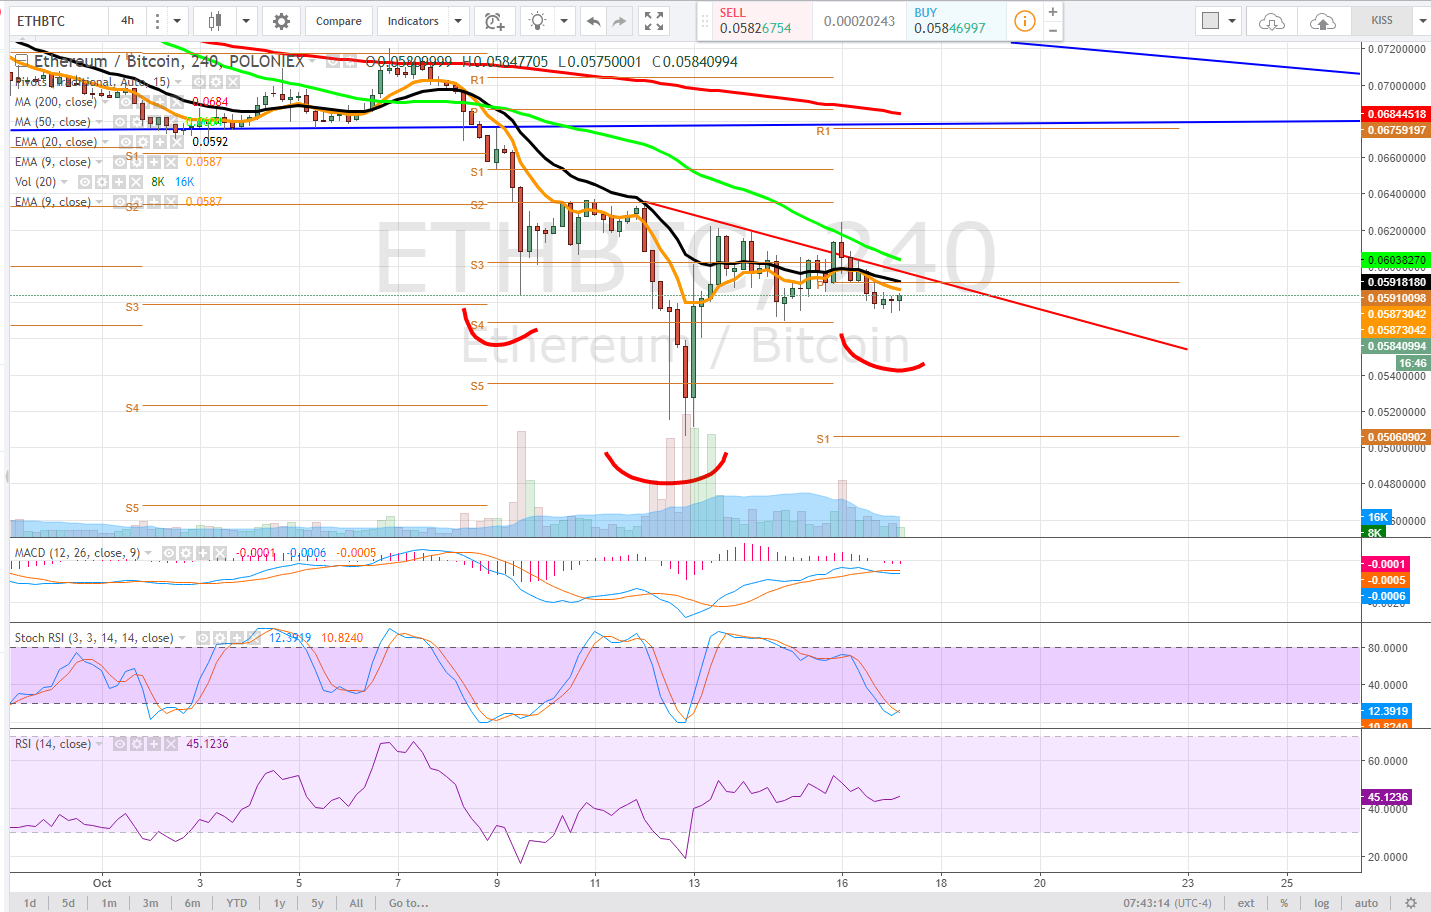
Another trade opportunity presenting itself is in the ETH:BTC pairing. It has taken quite a beating as BTCUSD went to the moon. Looking on the 4 hour time frame, ETH:BTC broke down out of a pennant, and has formed an inverse H&S pattern. If the price can reclaim 0.0595 we would be looking for a breakout.

Don't forget to use stop losses!!!
Previous Articles:
BTCUSD
DASHUSD
ZECUSD
BTCUSD
LTCUSD
XMRUSD
ETHUSD
NEOUSD
Follow at your own risk, Not a financial adviser, understand the risks associated with trading and investing. Manage your own Risk - in other words you could lose it all and it's your own fault.

Such a great post, thank you for sharing with us.
Good job
This post was resteemed by @steemitrobot!
Good Luck!
The @steemitrobot users are a small but growing community.
Check out the other resteemed posts in steemitrobot's feed.
Some of them are truly great. Please upvote this comment for helping me grow.
nice observation..nice post..