ZECUSD - Technical Analysis October 13, 2017 - Current Price $240.99

ZECUSD
We were looking at ZCASH a little while ago because of the sudden hype and subsequent pullback in the chart. We had been waiting for price stabilization and the risk trade was to go long into this dip, turned into a dead money trade. However, let's take another look.
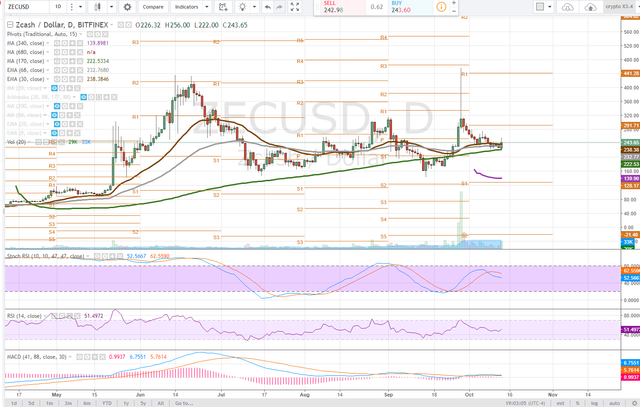
daily
On the daily time frame, support has been found and tested repeatedly at the 170dma with the price showing some bullish action. The price has since managed to move above the 30ema and 68ema on this time frame and it appears that a backtest of these moving averages is underway.
The stochastic RSI is in the mid ground with the MACD maintaining its bullish cross. The RSI while in neutral has curled up on todays price action.
Bulls look for the 30ema (brown) and 68 ema (grey) to continue holding and become support paving the way for a test of the daily pivot at $291.
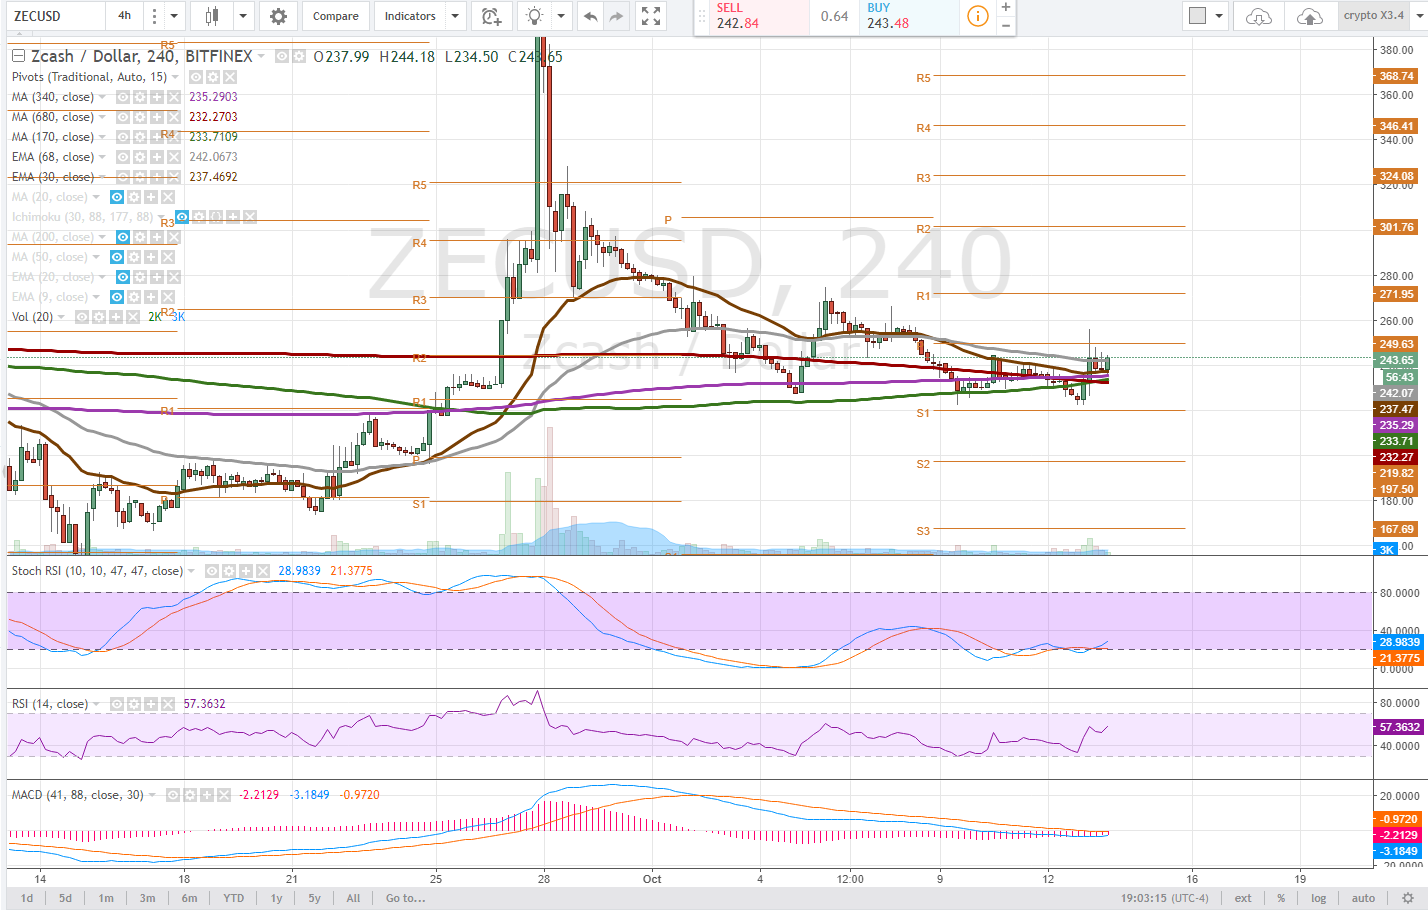
4 hour
The 4 hour time frame is showing us the same bullish action with a convergence of moving averages acting as support while a bull flag forms. The price has broken above the 68ema and for a run this level must hold.
Notice the stochastic RSI and the tightening range of the MACD. Continued volume will produce a bullish MACD cross while the RSI is trending upwards. The momentum indicators on this time frame look very conducive to price progression with the first resistance on this time frame being pivot, $249.63.
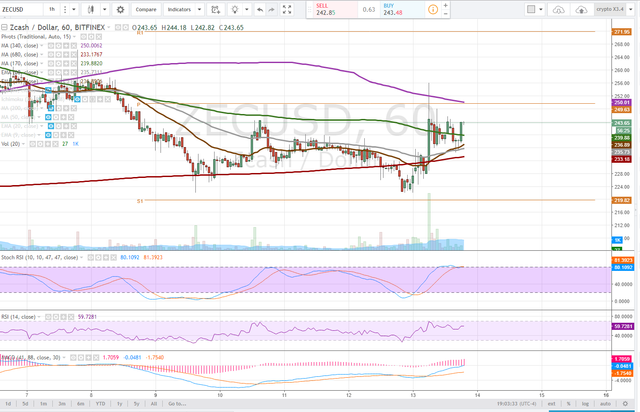
1 hour
On the 1 hour time frame we are observing a bounce off of the 68ema as the 30ema has crossed above (bullish). Looking for continued volume to deliver a bull flag breakout - top of the range would be the pivot, $249.63 on this time frame as well, where the 340dma(purple) has landed and begun flattening its curve.
The stochastic RSI has only just reached uptrend on this time frame and we should look for continued momentum, via volume.
Bullish Above: $251
Bearish Below: $233
RISK TRADE: Accumulate a long position here all the way to $235 68ema. Use stop losses or be willing to take a loss if price loses 68ema and then 680 dma on the 1 hour time frame. Looking for a test of daily pivot $291.
Don't forget to use stop losses!!!
Previous Articles:
BTCUSD
LTCUSD
XMRUSD
ETHUSD
NEOUSD
BTCUSD
DASHUSD
ZECUSD
Follow at your own risk, Not a financial adviser, understand the risks associated with trading and investing. Manage your own Risk - in other words you could lose it all and it's your own fault.

Awesome!... I do agree.
On the Daily timeframe chart I see price going to at least $290 to $300. From an Elliot wave angle it's likely ending a wave 2 move to prepare for a Wave 3 which should easily push price to the above mentioned levels. A push above $291 pivot to retest $400 price level.
A 20 period CCI also confirms the probability of your analysis. Likely bullish into next week.
Yes absolutely! $291 is just first milestone if the stars keep aligning. Just liking the set up after the hype pop and drop, have been monitoring it.