BTCUSD - Technical Analysis October 16, 2017 - current price $5670

BTCUSD
So we had watched BTCUSD explode overnight just 3 days ago and w were watching for a pullback, dip buying opportunity and the low $5400's were delivered during this price consolidation. The price did manage to tap $5900 which is quite impressive but may be attributable to the FOMO related to the BITCOIN GOLD fork on October 25th.
daily
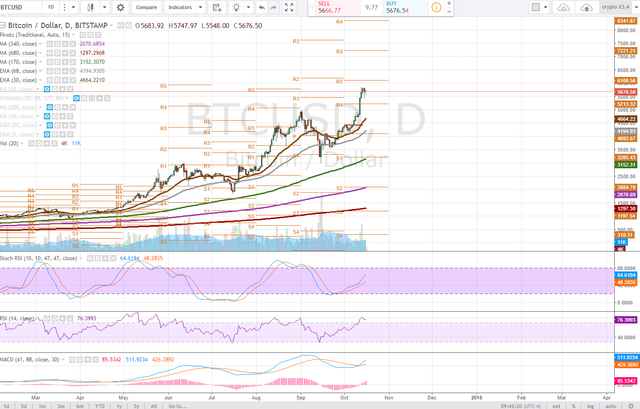
On the daily timeframe, BTCUSD has been unable to break out of 5900 and is in a wide consolidation range, it appears a bull flag is forming. Traders were clearly taking profits after the monster run, and this should be no surprise.
Looking at the stochastic RSI there is still a lot of room to go on this time frame, after some consolidation which would normalize our RSI. This is essential for healthy price progression, though we are aware BTCUSD can run in overbought ranges for some time.
This run produced a bullish MACD cross on the daily time frame. Resistance is found at $5903 and support is found at pivot $5213 (yes some ways off.) we should be looking for the moving averages to catch up to the price during this consolidation.
4 hour
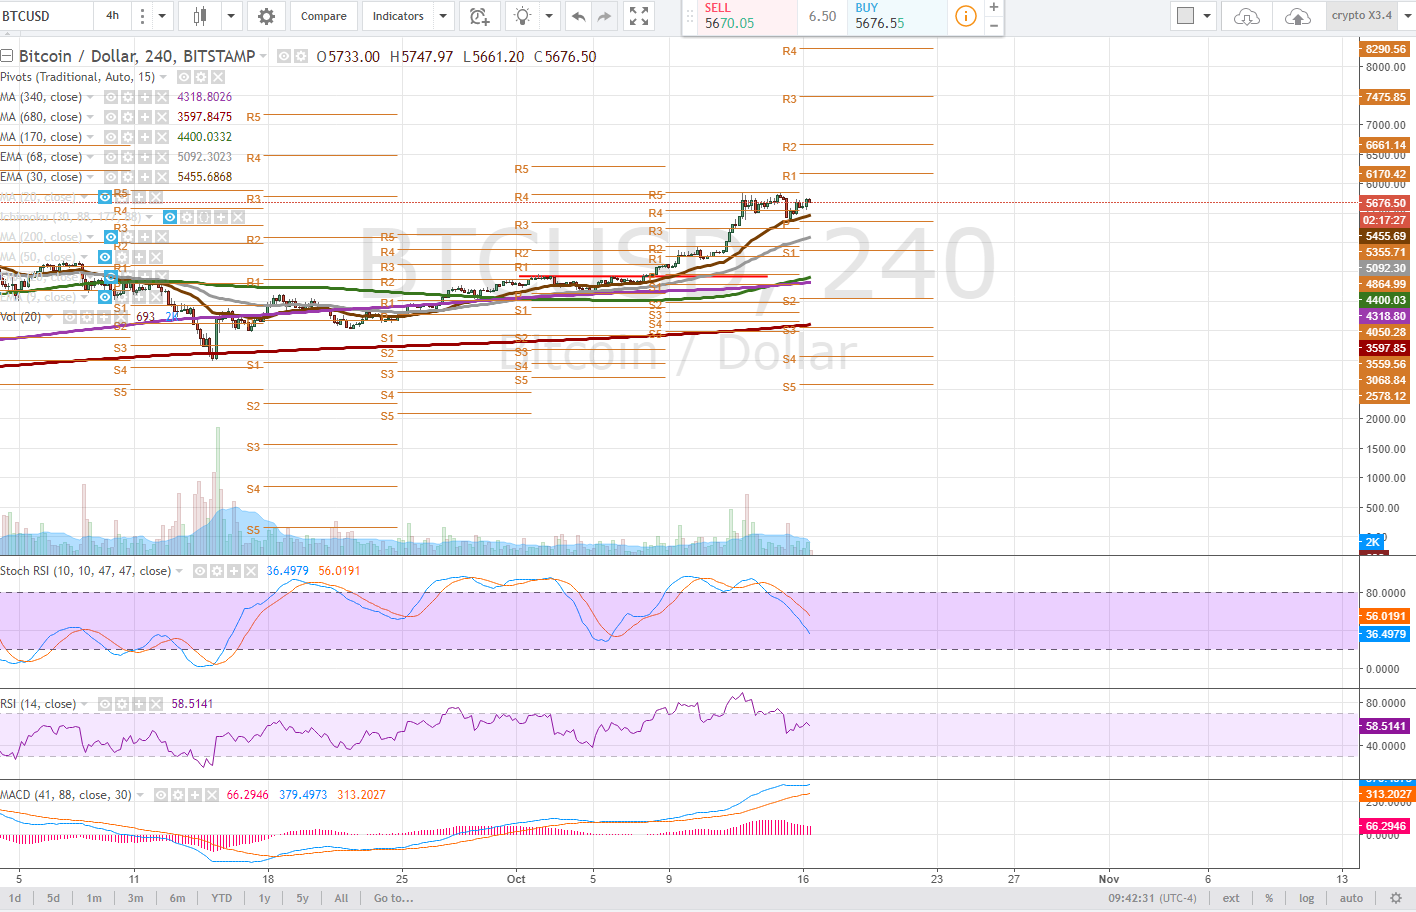
The 4 hour time frame provides a little more clarity and allows us to determine some nearer term price points. Traders should be watching for the full cycle of the stochastic RSI on this time frame as it is already in a downtrend. Completion of this cycle, may mark the completion of this consolidation phase and may only take another day or so to play out.
The RSI on this time frame is much less concerning, however, the MACD has begun to curl downwards and we should be watching for a lower high to be set and give us another pullback to the 30ema (brown line - $5455) and perhaps the daily pivot support $5355.
Important to note, and bullish is the declining volume during this consolidation, a spike in volume will mark the next move.
On this time frame make note of the bullish moving average cross, 170dma above the 340dma.
1 hour
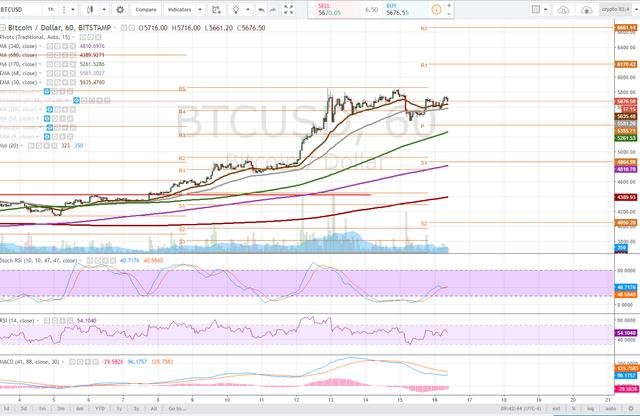
The 1 hour time frame provides more insight where the price found resistance at the previous weeks, pivot r5, $5857.
So far the 30ema (brown line) and 68ema (grey line) have provided solid support, but their tightening range and convergence should be reason for traders to be cautious of another pullback, below the 68ema ($5581) traders will look for pivot ($5355) support and if this fails we look to the 170dma, $5281.
A bullish MACD cross appears imminent on this time frame as the stochastic RSI is hanging in the midground, neutral range as is the RSI, though it has a clear uptrend from its previously oversold conditions.
Bullish Above: $5860
Bearish Below: $5280
RISK TRADE: Accumulate a long position here all the way to the 1 hour pivot, $5355 on the 1-hour timeframe sell below the 170dma, $5280
Don't forget to use stop losses!!!
Previous Articles:
DASHUSD
ZECUSD
BTCUSD
LTCUSD
XMRUSD
ETHUSD
NEOUSD
Follow at your own risk, Not a financial adviser, understand the risks associated with trading and investing. Manage your own Risk - in other words you could lose it all and it's your own fault.


hy sir check my post about bitcoin and give me some advice about it
This sound analysis, but as it is, I would wait and not fall into another FOMO trap :)
Good article Satchmo!!