Helping Communities 'Go Green'
It is inconsequentially easy to take for granted the many luxuries and conveniences that improve our quality of life. Electricity and other ingenious inventions of amenity can provide comfort and security, but they also have the consequence of altering our environment. Fortunately, advancements in technology offer the option to make ecologically conscious choices that can help to diminish negative impacts on our planet. Renewable energies are a prime example of this progress; the various forms are increasingly competitive alternatives to the fossil fuels that have thus far powered the progress of civilization.
Though many of these alternatives are not new, an increasing worldwide demand for clean, affordable energy sources has spurred innovation while improving efficiency and significantly reducing overall cost. Despite being more affordable than ever, the widespread implementation of alternative energies has been painfully slow. Some hurdles to this vision include the substantial initial expense of having the technologies installed, a lack of practical information regarding the available options, and uncertainty pertaining to which of the many possibilities is best suited for each unique location.
Solar and wind are two of the most widely utilized alternative energies, and both can be successfully implemented in suburban settings. In previous articles I have made an argument for geothermal energy and started to look in depth at 'shallow' geothermal which can work on small property parcels. Today I am going to focus less on the specifics of a given alternative and more on how to make informed decisions regarding the best environmental practices for a given property.
If you have read my previous posts, you might be able to guess what tricks are up my proverbial sleeve. I passionately believe that the best approach to solving complex environmental problems is to consider how GIS and spatial data can be utilized. The best way to accomplish this may not be obvious at first glance, but ultimately it all builds upon one incredible type of file - a Digital Elevation Model (DEM).
Elevation, Modeled Digitally
True to its name, a DEM is a digital image where elevation is represented as the value of each pixel. This allows the image to be displayed using a color ramp or gradient, providing an excellent way to rapidly visualize topography and terrain. Due to the gridded structure of rasters, it is also possible to perform more complex operations such as matrix mathematics - a concept that will be acutely examined in a future post.
But Where?
Before we can start working with a DEM, we must narrow our focus to a relatively small area. In theory, this same analysis could be performed for any location where adequate elevation data is available. For this post, I have chosen to take a closer look at the community surrounding Como Lake in Saint Paul, Minnesota. You might remember this location from my previous post Breathing New Life Into Old Biological Studies with GIS. It is a good read to gain some background knowledge on the area and its wildlife, but is not a prerequisite for what will be covered in this post.
Artistic watercolor map of Como Park Neighborhood. Note Como Park and Como Lake in the center of the image.
Map tiles by Stamen Design, under CC BY 3.0. Data by OpenStreetMap Contributors, under CC BY SA.
Getting the Data
Elevation data is available in a few different resolutions for this part of Minnesota. The entire state is covered by a 30-meter resolution file available here, but why stop there? There is now an elevation model from MNTopo based on LIDAR data that has a resolution of 1-meter for the Twin Cities Metro area. Their web interface makes it extremely easy to select the area of interest and offers several different formats for download including hillshades, 3-meter, and 1-meter models.
For the Como Lake community, the 1-meter DEM is more than 600 MB to download. This may seem like a large file, but GIS software is capable of handling it. Just to make things a little easier, I have clipped the data to the extent of District 10 - one of 17 Districts in the City of St. Paul and the area that encompasses Como Lake and Como Park.
Digital Elevation Model of District 10 (Como Park) in Saint Paul, MN. Como Lake is the dark purple area in the center of the map. Note the individual neighborhood blocks defined by intersecting low spots representing the roadways.
A great deal of useful information can be gleaned by just looking at the DEM. For example, the lowest elevation areas (purple) surrounding Como Lake are easily discernible and could broadly be projected as higher-risk flood zones. You can even pick out the excavated pits of a former sand and gravel quarry as the blue area in the lower left corner, bisected by an elevated and sloping railroad corridor. Before reading too deep into the raw DEM, I should reveal that the true power of this type of file is in the derivative products that it can produce.
Tools of the Trade
Grass GIS
© 1998-2017, GRASS Development Team, CC-BY-SA 1.0
A series of advanced analyses are possible using another open-source GIS software suite called Grass GIS. It can be a little confusing at first as it was originally designed to be command-based. However, the unique toolkits and formulas contained within compensate for these shortcomings.
Quantum GIS
QGIS is an amazing open-source program that I use for most GIS tasks. In this article, it will be used for terrain analysis calculations such as Slope, Aspect, and Hillshade. This software is ideal for both beginners and veterans of GIS, and should even be intuitive for ArcGIS users!
Derivative Products
Slope
The rate of elevation change on a surface is referred to as the slope. This concept will be painfully familiar to anyone who has ever walked up a steep hill. It is very easy to calculate slope and other derivative file types using a DEM and GIS software. In QGIS 2.x with the Terrain Analysis plugin installed (included by default in the most recent version), simply run the Slope tool in Raster -> Terrain Analysis -> Slope and use the clipped DEM as the elevation layer. For the Como Park neighborhood, the result looks like this:
The slope of the earth affects the rate that fluids move across the land. Slope is also a critical factor in regard to soil stability and propensity for erosion. Thanks to that classic force known as gravity, water accellerates down steep slopes and collects in basins such as Como Lake. In contrast, wind speed increases across flat surfaces and is hindered by steep and abrupt changes in slope or terrain. The suitability for wind power on a localized scale is closely related to the roughness of the surface. Roughness (aka ruggedness) can be modeled in QGIS based on a DEM - Raster -> Terrain Analysis -> Ruggedness Index, with a result that is visually similar to the slope graphic. This suggests that Como Lake and other cool colored areas with little slope should consistently see higher wind speeds than warm colored areas with steeper slopes.
Aspect
In thinking about the amount of solar radiation that reaches the surface in any given location, a good place to start is by looking at the aspect, or the direction that the land slopes. Generating an aspect model is fairly straightforward - open the menu with Raster -> Terrain Analysis -> Aspect and input the DEM as the elevation layer. The resultant output file will present the aspect in degrees, stretched with a monochrome color ramp. This is not very easy to interpret at a glance, so I have applied a custom color ramp that accentuates the four cardinal directions with a different color.
Aspect map where color represents direction (north=blue, east=green, south=yellow, west=green. In extremely flat areas such as Como Lake, the lack of elevation change yields bizarre artifacts for aspect.
Aspect is not only an important consideration for optimizing the placement of solar panels, but it can also aide in the arrangement of garden beds and other plantings. In the middle latitudes of the Northern Hemisphere where Minnesota is located, south-facing slopes receive more solar radiation than north-facing ones. In the above figure, yellow areas will naturally receive more radiation than blue areas. Accordingly, east-facing green slopes receive more morning sun and west-facing red slopes receive more evening sun. Location and aspect alone are not enough information to determine the amount of solar radiation received - the steepness of the slope is also critically important, as well as the time of day and angle of the sun.
Hillshade
It is possible to calculate the way that sunlight hits a surface for any given day and time. These models, known as hillshades, can be generated throughRaster -> Terrain Analysis -> Hillshade. This requires some additional input, namely the horizontal angle (azimuth) and vertical angle (zenith) of the sun. The relative angles of the sun across the sky during different times and seasons can be precisely calculated to generate these input parameters. I used the tool found here to calculate the sun's angles for this location during different times and dates.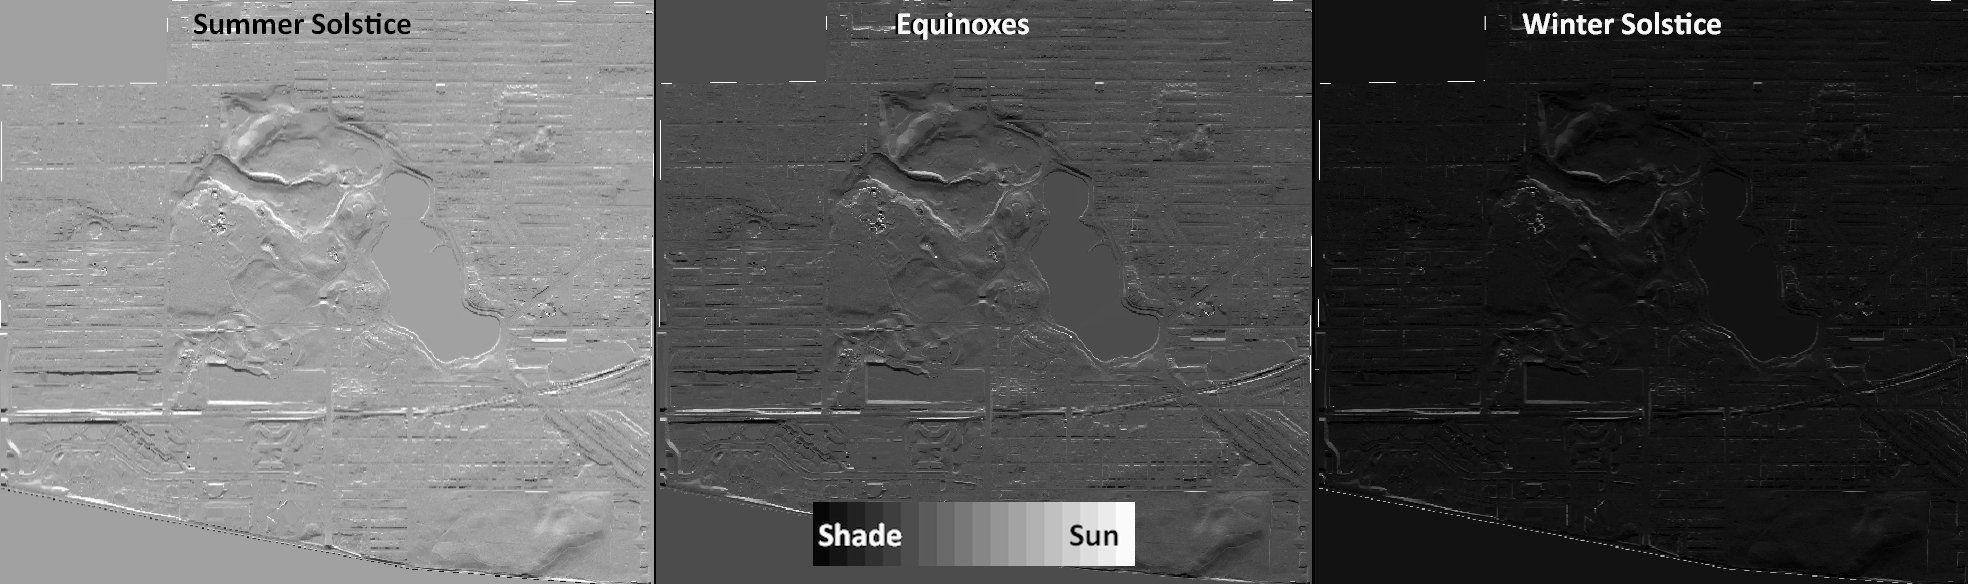
Andy Warhol inspired hillshade graphic showing midday sun on the two solstices and the equinox. This part of Minnesota is at a latitude of approximately 45 degrees north. The azimuth in the middle of the day is roughly 180 degrees, while the zenith changes from 68 degrees on the summer solstice to 45 degrees on the equinoxes and as low as 21 degrees on the winter solstice.
The above figures can be used to get a snapshot of the amount of solar radiation that will reach the surface for a moment in time. By using the solstices as sun angle input parameters, we get a glimpse of the maximum and minimum solar extremes. The equinox is the mid-point between these two extremes and provides an approximate average.
Hillshade diagram showing the differences in illumination during different times of day on the summer solstice. Note that the color ramp is applied over a relatively smaller range (207-253 rather than 0-255) in this figure to exaggerate the differences.
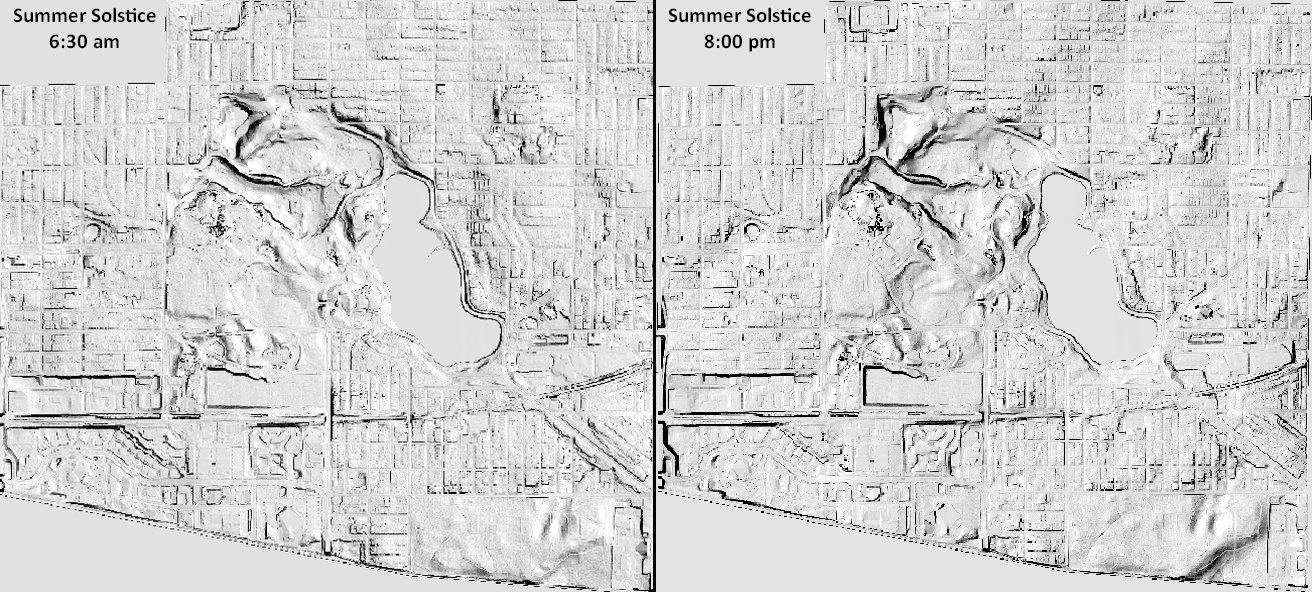
This graphic shows differences in shading between morning and evening sun. These are just two moments in time and hardly allow for a detailed consideration of the actual solar radiation that any location can expect throughout the course of a day, let alone a year. Fortunately, GIS has a solution for this known as the solar radiation model.
Solar Radiation
While hillshade models are useful to precisely see incoming solar radiation in a particular instant, a solar radiation model has the advantage of calculating and averaging multiple instants (from 1 day to 1 year) into a single graphic. Grass GIS has an excellent solar radiation model that can also be accessed through the latest version of QGIS. Once the DEM is loaded into either program, a model can be calculated atRaster -> Solar Radiance and Shadows -> Solar Irradiance and Irradiation. These models generally take an considerable amount of time and resources to process and will sometimes fail before finishing. Fortunately, I do not need to calculate solar radiation in this case! There is an open-source project created by Masters GIS students at the University of Minnesota that averages annual solar radiation for the entire state using the highest quality DEM and LIDAR data. Without further ado :
Although the color scheme is more sepia-tone than the hillshade models presented above, it can be interpreted in the same way. The areas colored in light yellow are going to receive a high amount of solar radiation year-round, while the dark areas are generally vegetated or forested areas where solar is generally a poor choice. There are several large areas with great solar potential including the lake, the nearby golf course, athletic fields, and commercial properties with flat roofs and large parking lots. On a smaller scale, many south-facing residential roofs could facilitate good solar production.
Flow Accumulation
Being environmentally conscious is about more than just considering alternative energies. The issue of water quality is one that is often misunderstood, due to the many varied sources of contamination. In urban environments, many natural surfaces are made impervious due to the roads, parking lots, sidewalks, and rooftops. In the Como Park neighborhood, the consequence of this is increased amounts of untreated surface runoff accumulating and concentrating in Como Lake.
In the winter, salts used to prevent ice on roadways are drained into the lake, increasing salinity and making the water less hospitable for freshwater aquatic wildlife. In the summer, nitrogen from fertilizers used on the Como Park Golf Course and other neighborhood lawns cause algal blooms and make the water unsafe to use. In the fall, decomposing leaves increase the phosphorus load in storm water, which can lead to decreased levels of oxygen in lake water. Fortunately, there is a relatively simple way to passively remove some of these contaminants from the water if it is targeted at the right point. To get an idea of which locations might work for this purpose, we can run the Flow accumulation model in Grass GIS through Raster -> Hydrologic modeling -> Flow accumulation. Using just the DEM as input, the resultant flow accumulation model looks like this:
Flow accumulation model for the Como Park neighborhood. Yellow represents a low amount of accumulation, light blue a moderate amount, and dark blue a considerable amount.
The dark blue areas are relatively flat, low areas where storm flow accumulates from multiple directions. These areas are the target areas for a type of remediation called rain gardens. The idea is that water is allowed to collect in small depressions and infiltrate the soil rather than flowing directly into Como Lake. These depressions are planted with specific plants capable of taking up considerable amounts of water and pollutants. This coupled with the natural filtering properties of soil greatly improves water quality.
High Resolution
So far we have examined these graphics for the entirety of the Como Park neighborhood, but this does not take full advantage of the incredible 1-meter resolution of the data. By zooming down to the neighborhood block scale, we can approach the limits of the data and start to offer possible recommendations for individual property parcels. I have chosen to focus in on the area to the northeast of Como Lake, as there is some unique terrain to consider in this area.
An overview of the Como Park neighborhood showing the area of focus highlighted with a blue box. Base map by OSM.
DEM
The DEM color ramp has been stretched over a smaller range to accentuate the terrain. Note how the land slopes toward Como Lake to the West (left) and also toward a valley to the north (top). Roadways and sidewalks are clearly distinguishable, as are houses and fences.
Slope
Several areas with relatively steep slope can be seen in this figure. The steepest areas tend to be along the borders of properties, where the sidewalk level is significantly lower than the yard. The open area in the southeast section of the block is mostly flat, as are the majority of backyards.
Aspect
Visualizing aspect at a small scale makes for a very interesting and informative graphic. The depressions along fence lines between each property can be seen; even the crown of the roadways is distinguishable. This is a great graphic for garden planning!
Hillshade
This hillshade view is at noon on the Summer Solstice. The areas receiving the lowest amount of solar radiation in this model appear to be the steeply sloped areas facing north and west. The hillshade model does not directly take the presence of vegetation into account.
Solar Radiation
The solar radiation model at a close scale clearly reveals the best locations to receive solar radiation. These are generally south-facing roofs that are not sheltered by tree canopy. The open area in the southeast corner of the block is also a good possible location for a solar array.
Flow Accumulation
In areas with changing elevation such as this block, the flow accumulation models are quite intricate. Many areas of high water accumulation (dark blue) exist along the fence lines and along the curbs of the street. These areas are good candidates for curb-cut rain gardens.
What About Geothermal?
Ah, yes. This type of data can also be used to estimate where shallow geothermal might be the most effective. I suppose this post is long enough already, so I'll have to save this subject for a future post. Just as a teaser, the soil type and density, depth to bedrock, and moisture content are all critically important in determining how efficiently a geothermal heat exchange installation might perform. This will involve integrating some additional data sets with the DEM-derived products that we discussed today to create a custom model for geothermal potential. We are only just beginning to consider the vast powers of GIS!Parting Thoughts
Starting with just an elevation model, we have used the power of GIS to produce multiple derivative products that can be used to estimate various environmental properties throughout the Como Park neighborhood. This is truly just the beginning of what can be done using this data, but I'll have to delay going in to further detail until a future installment.
It is feasible to do this sort of analysis anywhere with a sufficiently detailed digital elevation model. As the coverage and resolution of these models improves with each passing year, anyone with a little patience can make accurate assessments of alternative energy potential on a neighborhood scale and arrive at informed decisions regarding the best practices for our environment. Thanks to the wonders of GIS, you no longer need to pay a contractor or consultant for this type of detailed assessment!
The Earth is the only home we have. If we do not collectively work together to reduce our impacts and preserve the health and viability of our planet, we will surely accelerate our own demise. This sounds like a pretty bleak future to me, wouldn't you agree? Let's do everything in our power to avoid it! I would be happy to help you do this type of assessment for your own neighborhood or property - contact me on Discord if you are interested!External References
- GRASS Development Team, 2017. Geographic Resources Analysis Support System (GRASS) Software, Version 7.2. Open Source Geospatial Foundation. Electronic document: http://grass.osgeo.org
- QGIS Development Team (2018). QGIS Geographic Information System. Open Source Geospatial Foundation Project. http://qgis.osgeo.org".
- Basemap in the 'Focusing In' graphic: © OpenStreetMap Contributors, under CC-BY-SA 2.0
- Basemap with watercolor view: Map tiles by Stamen Design, under CC BY 3.0. Data by OpenStreetMap, under CC BY SA.
- DEM Data: MnTOPO is a collaborative effort between staff from the Minnesota Information Technology (MN.IT) @ Minnesota Department of Natural Resources and MN.IT @ Minnesota Geospatial Information Office (MnGeo). Funding was provided by the Clean Water Fund of the Clean Water, Land and Legacy Amendment.
- Solar Data: Minnesota Solar Suitability Analysis, an open-source project by MGIS students at the University of Minnesota.
One feels they're in good, expert hands when reading your posts. An excellent job as always, and humanitarian. If only our Cyprus government would hire someone like you!
Wow, that is really kind to say. Thank you! I would love the opportunity to do this sort of an analysis for anyone who is interested...send them my way! For a place like Cyprus, it might even be feasible to cover the entire island if there is elevation data available. Hopefully this post will lead to some future work!
Yeah, that's what I don't get. So much sunshine. Why isn't my electricity bill $0?
I find this post quite fascinating being a renewable energy enthusiast for as long as I can remember. Awesome work here mate.
I am glad you found it to be fascinating! GIS can be applied in so many different ways that it never gets boring for me.
It may not be much, but anything that I can do to encourage people to move that way is better than nothing. Good to know that there are other renewable enthusiasts on here...Thanks for the comment!
Thank you too for the amazing work.
Oh boy, that was too scientific for my brain to handle. Hahaha.
But it is good to know about GIS. I only know Google Maps. :D And I agree, solar panels are expensive but maybe big companies or corporations can use your suggestion.
Does that mean Como Lake is polluted and needs a clean up drive or something?
QGIS is 397MB whoa...
It is my goal to make every post approachable, so my apologies for the parts that were confusing! Feel free to ask any questions regarding sections that could use clarification.
I'm always happy to spread the good word of open-source GIS! If contractors and installers spent more time considering solar radiation throughout different times of the year, the efficiency would greatly increase, thus reducing the time required to pay off the expense and making them more affordable for everyone!
Como Lake is indeed quite polluted . There have been many studies by the Capitol Region Watershed District considering the level of impaction, and several projects by the Como Active Citizens Network attempting to improve the situation, but progress is slow.
QGIS is a very hefty download, mostly because they have included a bunch of tools in the latest version and have actually integrated GrassGIS and SagaGIS . If you wanted to try a functional old version with a few less bells and whistles, version 2.6 should be a little smaller in size. Good luck! Thanks for checking out my post!
Our dependence on fossil fuel has led us inhabiting in this polluted world. Either because of the diminishing supply of fossil fuel or to prevent this massive environment pollution, we have to completely rely on renewable energy very soon.
Solar is the most promising form of current renewable tech. And geothermal can really be a good source of energy where temperature is relatively higher beneath the ground. May be somewhere near a volcano.
U have done an impressive assessment of potential renewable implementations on ur locality...!
I've worked on renewable with the help of HOMER previously. Its good to see the work done from the viewpoint of a geologist..!
Best regards..! 🙌
~ Christina
Fortunately we are slowly making progress towards a more renewable future. There is definitely a lot of promise in solar, but I would not discount geothermal as a widespread solution. People tend to think about geothermal in the traditional sense of volcanism, but shallow geothermal heat exchange systems can be installed practically anywhere and can greatly reduce heating and cooling expenses. I'll be doing another article on this in the future!
I have never heard of HOMER, but it appears to be fairly powerful (though also proprietary and a little expensive). It is good to know what else is out there in terms of software. I appreciate your comments and support!
yes.. thts another good scope of geothermal. hope to see u writing abt tht soon..!!! yah, HOMER is basically used for microgrid simulation, it acpts many forms of renewable and has feature of feasibility analysis too. A bit expensive, bt there is a free trail version if u want to explore the software.
Finally, I saw your posts that I've always been anticipating and it's very long as usual. I always salute your writing skills, gra....
Solar panels are wonderful but we prefer generating sets in over here though the rate of pollution is high possibly because of the prices and availability of the solar panels or maybe many people don't know about it...
Sorry that my posts are always so long, there is just too much that I want to say! In some regions petroleum remains the least expensive commodity, and it is difficult to drive a change if the market does not support it naturally. I appreciate your perspective!
Yeah.... Petroleum is our major source of funds over here... The government even depend too much on it..
Really great read! We must really encourage all communities across the world to go green, there are so many untapped renewable resources that could be used instead!
Couldn't agree more with this statement!
Thanks for checking it out...I am glad that my message resonates with you! Hopefully the blockchain will prove to be a good medium through which to spread the word!
The blockchain is a pretty useful tool for spreading information and it will be even better when we get more people in here :-D but going green is something that can't be left alone to the governments, communities across the world must be mobilized and motivated to go green to help us prevent a catastrophic end.
It's going to take a collective effort to keep the earth in a proper shape, for life to thrive successfully on it.
I agree wholeheartedly. Only by working together towards a common good will we be able to chart a path towards a stable and secure future. Thanks for your thoughts!
The problem I believe is that the solar panels are expensive to install. Once they become affordable for everyone, I believe there will be a mass adoption. Great share @gra
Thanks for your comment, I hope you are right! I think solar is only part of the solution, though...a multifaceted approach is more likely to succeed.
Dear steemians!
Your publication has been very important for our community @investigations
Follow us and meet people with the same goal about science and technology
regards!