
After dive phase in January, to the lowest point at the beginning of February when Bitcoin touch levels below $6000, it was very unpleasant time.
We closed positions, someone at the right moment to book some profit,
someone book minor losses and someone was slaughtered to the bare bones. Some hodlers was even quite fine knowing that Bitcoin bubble bursting is relative common event. Through the February situation calm down and recovery starts. Now we are at the tipping point towards another ride upwards.
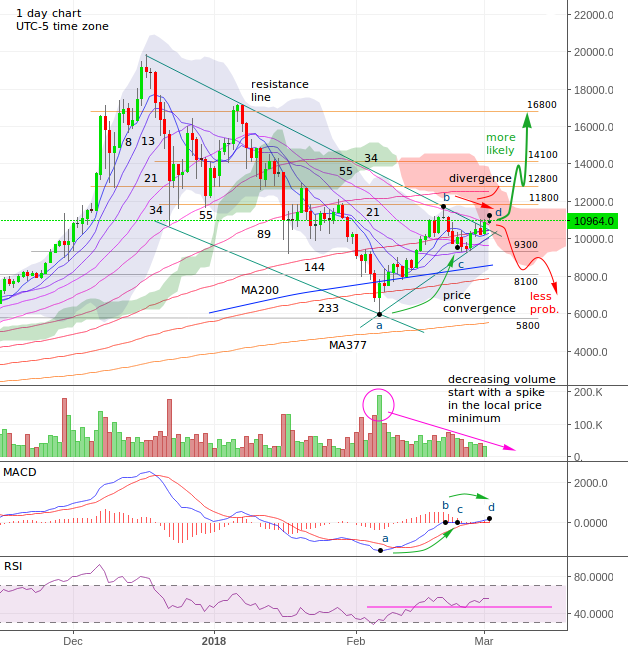
But We are still not out of dark woods. Ichimoku cloud is red and price just touch the bottom edge of the cloud. Technically we are still in downtrend channel and price is in the process of breaking the resistance trend line. On the chart is evident how MA lines are aligned with trend line and serving as resistance lines inside wedge shaped in last two weeks.
Chart beautiful explain why price tend to form wedge shape consolidation patterns. Upper trend line is formed from equipotential MA lines (55, 34, 21) and is bounded with resistance line connecting lower heights.
Lower bound of wedge pattern is influenced by long period average MA lines as the lower bound. Support line connecting higher lows is not always aligned with MA support lines. long period average MA lines are strong resistance levels and sometimes price don't make lower heights in straight support line, so lower edge of the wedge sometimes get blurred.
If trading activity is to low indicated with low or decreasing volume, price can break down through long period MA lines, on the other hand if bulls are active and volume is high and increasing, the price tend to try break through the upper MA lines and price make a breakout through the upper resistance area and continue upwards to the next resistance areas in a bull rally.
In the present case we have decreasing volume start with a spike in the local price minimum,
a price convergence with MACD in points a, c and mild price divergence with MACD in points b, d. RSI gauge is in the middle. All this are mixed signals not clearly pointing to anything.
We can count only on pattern where price is moving upwards from the local minimum (a)
towards Ichimoku cloud and in most cases it penetrate the cloud through to the upper side. This scenario leads to the breaking of $11800 level and very likely continuation upwards. If less probable rejection occurs in the cloud we stay in main downtrend channel and another downtrend swing will roll on.
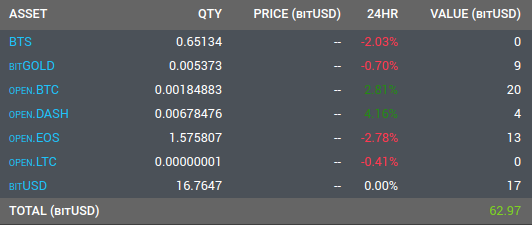
Our portfolio which i trade for you on BitShares DEX exchange in account bcd12 is doing quite well. I sold LTC and 60% of DASH ($15). we hodling EOS. I ladder in on BTC at 10470 - $5 and 10940 - 15 $. I plan to add more after $11800 resistance will be conquered. Hope that the price will move up to $12k to $14k levels to book some profits hopefully and than we will see how to go on.
Don't forget to check out this new TFDSRE thing Elliott waves are not the only thing, you can surf on: #1, #2, #3, #4. and explanation of EP lines @.
I started a thread of my old posts revival. Check it here @.
Previous analysis: #27,#28, #29, #30, #31, #32, #33. Is good to check them out to get insight into my reasoning.
Image sources: investing.com, google.com
Data sources: Bitfinex exchange
Disclaimer: If you use my ideas and analyses in your investment ventures, you take all responsibility and consequences about your actions.
What do you think about BTC price? Comment and present your views! Great ideas emerge from good quality discussion! I'll be immensely grateful for your contribution.
Check also technical analyses from TAF squad: @pawsdog, @futuristgear, @exxodus, @bi5h0p, @lordoftruth, @mazharkazmi, @toofasteddie, @gazur.
And as always upvote this post and previous ones, if it have some value, follow me, if you think this content is great and I promise that it will be more interesting stuff in the future. Let steem on, to the bright future!


Coins mentioned in post: