TFDSRE - Combining Equioitential Lines with Other Popular Indicators(#4)

Equipotential lines (EP lines) can be combined with other popular indicators very well. The most popular indicators beside moving averages which are essentially equipotential lines are MACD and RSI oscillators and I will add parabolic SAR because it is very useful for day traders to start buying as soon as possible after price change course and Ichimoku cloud for trend confirmation. In Ichimoku cloud conversion line, base line and lagging span are switched off because we don't need them on our chart. To achieve good trading performance traders are interested most in spotting good entry and exit points on market. Hitting those points as accurately as possible make good trading results i.e. profits.
Uptrend trading
To spot an uptrend sequence of events on MACD, RSI and Ichimoku cloud indicators have to be spotted in right order.

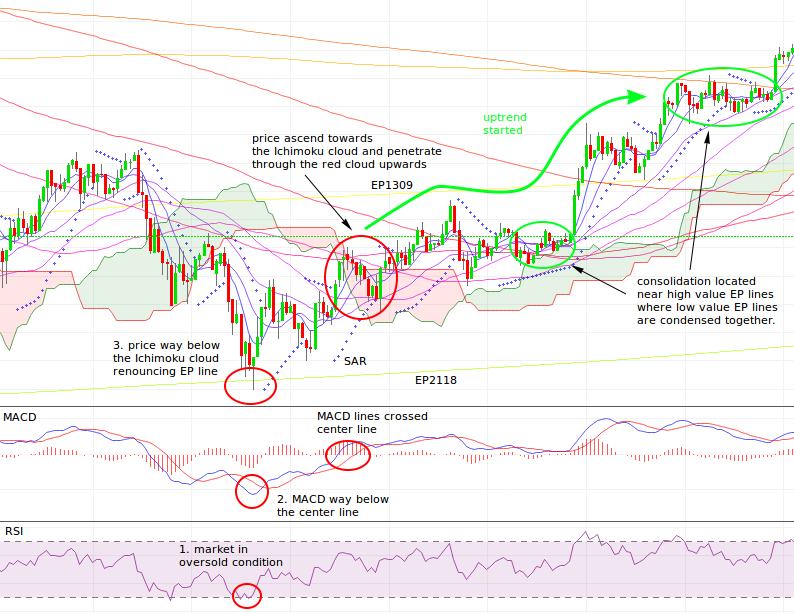
Figure 1. Uptrend trading scenario.
- market must be in oversold condition according to RSI
- MACD must be way below the center line
- price must be way below the Ichimoku cloud usually rebouncing from some high value EP line
After this three initial conditions price start to ascend towards the Ichimoku cloud and penetrate through the red cloud upwards and MACD oscillator lines crossed center line. When we start a trade and we are on the roller coaster we can enjoy upwards ride and start to spotting consolidation areas and possible target points to add more positions or exit trade. Consolidation areas are located near high value EP lines where low value EP lines are condensed together. Parabolic SAR indicator can be used to sweet spot points where consolidation ends and it's time to buy more positions or take partial profits. This scenario of events have very high probability especially when strong uptrend is anticipated. The stronger the trend more reliable is this sequence of events.
Presence of EP lines give us clues where support or resistance areas could be and are much more realistic and reliable than classic trend lines.
Remember! EP lines are trend lines but they are not static and created out of our experience but they are dynamic created independently of our personal biased judgment by calculating simple moving averages. Strength of this new view on trading charts is in increasing importance of EP lines as guides of our decision making process.
Downtrend trading
To find starting downtrend Ichimoku cloud can be used to confirm start of the trend. Similar sequence of events start downtrend except they are in opposite values as is the case with uptrend.

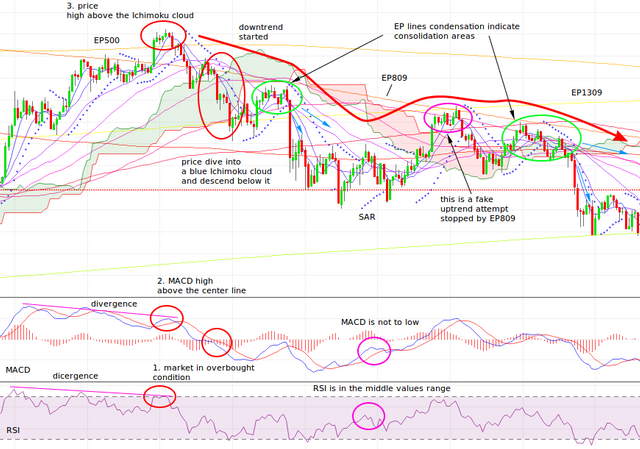
Figure 2. Downtrend trading scenario.
- market must be in overbought condition according to RSI
- MACD must be high above the center line. Very likely a divergence between MACD, RSI and price is formed. Price still rises but indicators start to descent and this is a classical sign of trend exhaustion. If also some high value EP lines build strong resistance to the price, this is additional sign of ending the uptrend.
- price must be high above the Ichimoku cloud usually rebouncing from some high value EP line
After this three conditions are meet price will dive into a blue Ichimoku cloud and descend below it. In the same time MCAD lines crosses center line of this indicator. When the EP lines condensate a consolidation areas are spotted and after consolidation a price descent follows and EP lines disperse. Traders who don't trading short must wait until another uptrend is confirmed or test their luck on day trade rides using SAR indicator.
Day trading tips and tricks
Day trading is special discipline in trading cryptos. Day traders try to exploit intro day volatility of price. Trades last for a few hours and tempo of trading is very intensive. Also high liquidity of the market is desired for this type of trading. Technique is essentially the same as in longer term trading. This style of trading is more emotionally intense and traders must train themselves to conduct quick decisions reliably. Traders trade on short period charts (15min 30 min 1h). I recommend to gradually move from 1 day frames to smaller one and adjust yourself to higher speed of events.
Image sources: pixabay.com, investing.com
Disclaimer: If you use my ideas and analyses in your investment ventures, you take all responsibility and consequences about your actions.
And as always upvote this post and previous ones, if it have some value,follow me, if you think this content is great and I promise that it will be more interesting stuff in the future.
Verry good post
Try to use this way of trading! I found out this EP lines are very informative to know where a price limitations are and what is an overall trend on market.
I will try to incorporate your ideas. I'm pretty new to this but your methods seem solid.
Be glad for fit back!