Is the One-Month Massacre in BTC Over? What do the Elliott Waves say?
@passion-ground a.k.a…
…The Chart Cast Pilot
...Certainly, one may hastily opt to rifle straight down to the BTC charts if they wish, however, the following two older video shorts are of @passion-ground doing some reflective and real-time technical analysis.
Taking the several minutes to view each of them in their entirety may well shed some light on my forecasting abilities and the level of detail in which I frame market structures and effectively employ my proprietary automated trading strategies.
Bear in mind that these two videos are from back in the days when YouTube had a 10-minute time limit. As such, I had to talk fast and succinctly to get all that I needed to say out there within such constraints. The first video is a reflective "fluff" piece all about Gold, and the second video was one of my "real-time" daily updates for subscribers of the "Chart-Cast-Pilot." I trust that you might enjoy these two @passion-ground blasts from the past.
BLAST FROM THE PAST -1 : Gold
IMPULSE, the video above, was a reflective 7-minute look back on my analysis of the Gold price from 1999 - 2010.
BLAST FROM THE PAST - 2 : Broad Market Summary
The video above was a real-time look at the broad markets in three timeframes, which I issued 6-years ago to my subscribers in February of 2012.
I hope the two Chart-Cast videos above provide some historical context insofar developing a level of faith and trust in my effectiveness and abilities as a market technician. With that said, let’s move on to look at the daily BTC charts and the one-month 60% massacre that the market just endured.
Is the Decline Over? ...What do the Waves Show?
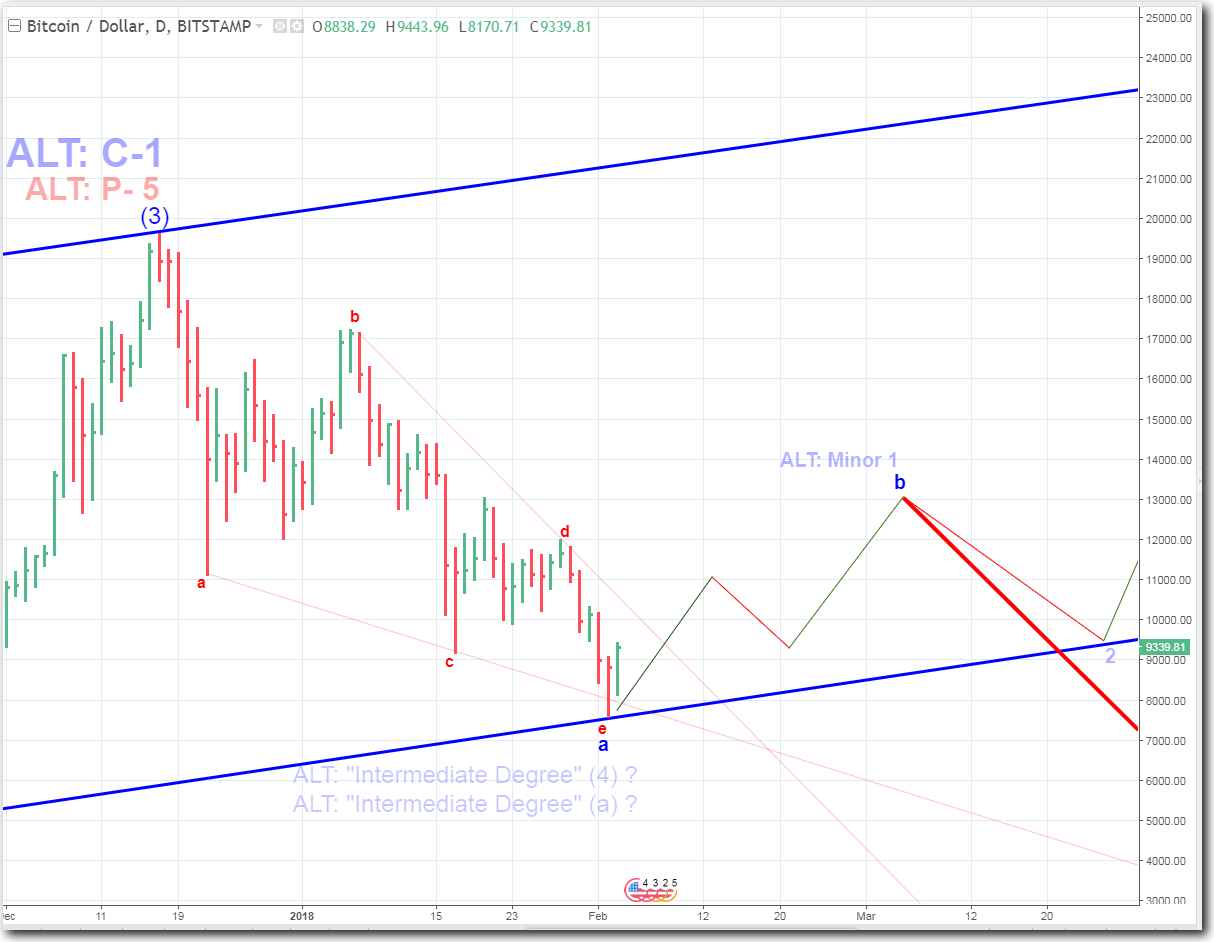
Below is a daily price chart of BTC in linear scale. The five-wave move down to the 60% massacre low is clearly “corrective” due to the overlapping nature of the wave structures illustrated in the a, b, c, d, e wave decline labeled in red. As an aside, the falling wedge pattern created by this structure is typically quite bullish over the short-term.

Okay, so what does that mean? ...Is this bear market over yet?
The straight-up truth is that yes, maybe this bear run is over, and no, maybe it’s not. I will explain the basis for this truth in terms of the Elliott Wave terminals, via the "preferred" as well as the "alternate" interpretations that I’ve carefully labeled on the charts throughout this post.
Firstly, identifying “key-terminals” along with the wave label and degree of a trend such terminals represent are paramount to the efficacy of predictive forecasting outcomes - both short-term and well into the future.
I think we can all agree that the all-time-high near the 20k level was a “key-terminal” – but with which wave label, and at which degree of a trend? Furthermore, a 60% market decline is also substantial enough to warrant consideration that a terminal low of some sort is at or nearing completion. But there again, what wave of low might it be, and at which degree of trend?
Answering the above questions most accurately, objectively, and pragmatically are the best means by which to then look forward and anticipate the various price patterns that can take place going forward.
I will attempt to answer these questions today. After doing so, from this point forward, the price action will need to be continually monitored closely to confirm or negate my current "preferred" and equally viable "alternate" interpretations.
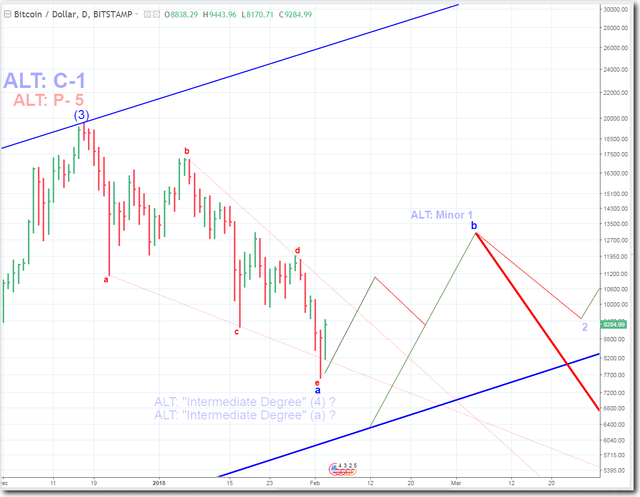
Before I move on, I’m going to drop another daily chart here. This is the exact same chart but in log scale this time. There are subtle differences but not too many, and the wave structures and labeling are the same. The major difference between the two is that the log scale below illustrates a lower trend channel boundary that price has yet to touch.

The 3 Most Likely Elliott Wave Scenarios
1st, The MOST BULLISH Case
The most bullish Elliott Wave interpretation that I am proposing, assumes that the “key-terminal” near the 20k high was that of a (3) wave of intermediate degree noted in the “preferred” blue label. It also assumes that the recent “key-terminal” low that registered yesterday is “all of” the “alternate” (4) wave down. Such a count would imply that the low for wave (4) is already in place and that from this point forward, the market is going to make its way back to making fresh new all-time-highs above the 20k level, and perhaps well beyond such levels.

2nd, The Intermediate-Term Bullish Case
This scenario is very similar to the first, however, if this interpretation turns out to be correct, then the recent print low registering more than a 60% market decline yesterday, is NOT marking all of (4) down, but rather it is marking a low at one smaller degree, (the minor degree) which is the preferred blue a-wave labeled. This scenario suggests that the intermediate wave (4) down is not yet over, and will require more than a month (perhaps several months) to resolve itself. However, once it does resolve, regardless of the pattern it eventually creates and the time it takes to do so, the larger degree (4) wave down will then have terminated, and the market will be cleared for a run back at the old highs and beyond.

3rd, The MOST BEARISH Case
The most bearish viable interpretation of the wave structures assumes that the “key-terminal” at the current all-time-high near 20k marked the completion of the alternately labeled P-5, which simply means that the 5th wave at the larger primary degree-of-trend may have already terminated with that print high. As such, the recent 60% decline could be viewed as an intermediate wave (a) down of (c) of the larger primary wave “A” of “C” down in answer to the primary degree 5-wave terminal.

If such bearish prospects unfold, whenever it is that the A, B, C primary decline resolves itself, such a terminal low may mark an extraordinarily bullish 2nd wave base at the even larger Cycle Degree of trend. This terminal would be an answer to the alternately labeled C-1 or Cycle degree 1 wave that ended in tandem with its underlying primary 5th.
In closing, I hope that I’ve provided everyone with a most accurate, fair, and balanced assessment as to the plausible wave counts occurring within the BTC market.
I realize that all of these fractal “degrees of trend,” “patterns,” and “rules” can seem overwhelmingly complicated to the casual observer. If one has the least bit of interest in this fascinating theory, I would strongly suggest going to Amazon.com and search for the book entitled: Elliott Wave Principle by A.J Frost and Robert Prechter, which is now in its 11th edition. It’s going for around $28.00 USD and worth every penny!
If you react to this book like I did more than 30-years ago, you won’t be able to put the book down, and it will become a constant source of repeated reference as you quickly grasp the concepts, power, and tenets that comprise this most profound and historically accurate theory of market behavior.
Until next time,
I think your bullish first case has the wrong picture uploaded. Can you check that? It is the same picture as in your second case, which does not make sense to me, because you were talking about new alltime-highs. Thanks bro.
Sorry for any confusion, @ew-and-patterns. I should have spelled out the following more clearly:
All three charts are labeled exactly the same. I just reposted them at various intervals throughout the article so that the reader could visually reference them easier.
The descriptions for each scenario are represented with the corresponding "preferred" and "alternate" wave labels within the chart.
In the first (most bullish) case to which you refer, whereby if the recent low turns out to be the base of (4), thereafter I note prospects for an Alt: minor 1 up, and Alt minor 2 down. There was not enough chart space to the right to show a general price path projected for the Alt: minor waves 3, 4, and 5 going to new all-time highs.
I hope that answers your question. Thanks for asking, brother.
I think that is a little confusing for people. I don't want to criticise you too much here, but if I want to give some alts, I always show the corresponding price pathway with it, too.
Not everybody has the knowledge and/or imagination to form a clear picture of the described scenario in their head, without seeing it in a picture.
You had me confused for a second, too lol.
Fair point. No criticism was taken. :-) Thanks!
Hey brother, I've just posted two "Chart-Casts" in attempt to clarify the contents of this post. Perhaps you may wish to check them out - and let me know your thoughts...
Here's the link:
https://steemit.com/bitcoin/@passion-ground/btc-elliott-wave-101-the-big-picture-plus-clearly-defining-the-risk-of-absolute-ruin-for-btc
Feel free to "re-steem" if you are so inclined... Cheers, mate!
Very well done, nice post
Thanks for this, surely an eye opener.
To the question in your title, my Magic 8-Ball says:
Hi! I'm a bot, and this answer was posted automatically. Check this post out for more information.
Nice bicoin
Motivation for me, thank you for sharing
I'm sure time will tell, at least in bitcoin.