Descriptive Statistics- Review for Beginners Pt 1
Hi All!
Welcome to todays episode on Statistics! I am currently reviewing Descriptive Statistics before I begin my studies again and I decided to post a little review for anyone that might need it or simply enjoys it. If you like it and would like more, let me know. This is basically a trial run.
Note: I am not an expert in Statistics. I simply enjoy it and used the internet to compile this information. References are at the end. Enjoy!
-------------------------Lets Begin!------------------------------------------------------------------
I. What are Descriptive Statistics?
-Descriptive Statistics allow you to summarize data in order to present it in an understandable way. In other words it breaks down the data into a summary. This way one can see the overall performance of a population or how spread out your data is. Ultimately, it helps to describe and show the data.
Examples: Calculating batting averages or general performance of students in a course etc.
-It DOES NOT allow you to make conclusions or inferences about the data itself.
II. Univariate Analysis
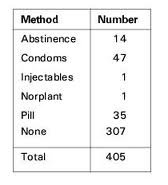
-Univariate Analysis is the simplest form of analyzing data. It means your data only looks at "one" variable at a time. An example of a variable could be "height", "age" or "weight" etc. (more specifics on variables in a future post)
 <- Frequency Chart (reference for picture at the end)
If one added another column to this chart for "age" of people using those methods it would become bivariate data because two variables would be looked at instead of just one.
III. Ways to describe patterns in a Univariate Analysis (in other words measurements used in Descriptive Statistics)
1) Central Tendency- Is the estimate of the "center" of a distribution of values. Mean, Median and Mode are used to describe this.
a) Mean- Is the "average" of all the values you have. To compute the mean add all the numbers in your dataset together and divide it by the number of items you have.
For example, lets say 8 students took a quiz and these are their scores:
15, 20, 21, 20, 36, 15, 25, 15
To calculate the mean simply add all the numbers together: 15+20+21+20+36+15+25+15= 167
Now divide 167 by the number of students (items) you have. We have 8 students so
167/8= 20.875
The mean, or the average score on the test was 20.875
b) Median- Is the number that lies exactly in the middle AFTER you have arranged the values in order. Overall, the Median helps you get an idea of how your data is distributed. It lets you know if your data is skewed in some way.
For example, a group of 5 children were weighed and they weighed: 60lbs, 62lbs, 65lbs, 74lbs, 57lbs (lbs=pounds)
So our set of values are: 60, 62, 65, 74, 57
If we want to find the Median we first arrange the values in order, so: 57, 60, 62, 65, 74 and then find the value exactly in the middle.
Median=62
Wait! What if we had another child added to the group that weighed 61lbs, what would be the Median then?
Set values would then be: 57, 60, 61, 62, 65, 74
In this case, add both central numbers and divide them by 2. In other words you are calculating the average or mean of these two numbers (we talked about this just before!). The result is your median.
So, 61+62/2= 61.5
The Median of this set of values: 57, 60, 61, 62, 65, 74 = 61.5
Note: When your Mean and Median are the same you know your dataset is "normally distributed". If they are different then it is skewed in some way. This can be due to having very high or very low values in your dataset.
c) Mode- Is the most common number in a dataset.
For example, lets say there is a group of 5 adults and their ages are: 34, 40, 32, 47, 40.
So your set of values are: 34, 40, 32, 47, 40
To find the Mode just find the most repeated number (hint: ordering the numbers help): 32, 34, 40, 40, 47
In this case we can see that 40 is repeated twice.
Therefore, Mode=40
2)Dispersion-Describes how spread out your dataset is. Meaning, if your data is scattered or packed tightly together. Range, Standard Deviation, Variance and Quartiles are used to describe this. (To keep this trial post short and friendly I will concentrate on only Range and Standard Deviation. If liked, in the future i'll expand on the rest)
Example of a dataset that is scattered is this: 2, 12, 60, 2 , 100
Example of a dataset that is packed tightly together is this: 2, 4, 5, 5, 3
a) Range= Is the highest value in your dataset minus the lowest value
Going back to our first example of 8 students who took a quiz and scored:
15, 20, 21, 20, 36, 15, 25, 15
The Range would be the highest value (36) subtracted from the lowest value (15)
Range= 36-15= 21
Range=21
b)Standard Deviation- Is how spread out are the numbers from the mean or average.
To calculate the Standard Deviation find the distance between each data point and the mean. For this next example we will calculate the Sample Standard Deviation and also see what the Population Standard Deviation would be (they are different).
Lets say you have a set of values that represent the age of 5 children when they first travelled: 6, 5, 11, 13, 4
To start, find the mean
Mean-> all numbers added/number of items (children) = 6+5+11+13+4= 39/5= 7.8
Now, Step 1: subtract the mean from each data point and see their differences from the mean. Values under the mean will be negative and over the mean will be positive. The (+) are written just to illustrate that they are over the mean. No need to write it. Step 2: Square the results and add them. Step 3: Take the total of the results in Step 2 and divide by the number of items you have minus 1. Yes, minus the number 1. (Note: Once you calculate this step you get the Sample Variance. If in this step you just divide by the original number of items 62.80/5=12.56 you get the Population Variance.) Step 4: Find the square root of the result in Step 3 and you get the Sample Standard Deviation. If you want the Population Standard Deviation find the square root of the Population Variance. So, the square root of 12.56=3.54 would be the Population Standard Deviation.
Step 1 -> 6-7.8= -1.8 Step 2 -> (-1.8)^2= 3.24 Step 3 -> 62.80/5-1 Step 4 -> Sqr root of 15.70= 3.96
5-7.8= -2.8 (-2.8)^2= 7.84 62.80/4= 15.70
11-7.8= +3.2 (3.2)^2= 10.24
13-7.8= +5.2 (5.2)^2 = 27.04
4-7.8= -3.8 (-3.8)^2= 14.44
TOTAL: 62.80
Hurray! You got it!
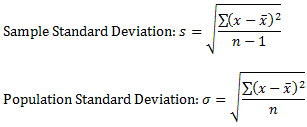
Now, here is the formula you will find in textbooks or if you google standard deviation online. This is what we calculated step by step.
If you look at the bottom of the formula (n) and (n-1), that was our Step 3 without looking for the square root (Step 4). The (n) just means the number of items you have.
That's All! Thanks guys for tuning in! Rememeber to upvote if you enjoyed it!
References used:
https://statistics.laerd.com/statistical-guides/descriptive-inferential-statistics.php
http://www.nedarc.org/statisticalHelp/basicStatistics/measuresOfCenter/median.html
Image Source:www.statisticshowto.com/univariate/
Image source:dsearls.org/courses/M120Concepts/ClassNotes/Statistics/

Hey this post is right up my alley - I work in market research and a good chunk of my job is analysis / statistics. Nice clearly written and understandable post outlining some of the basics. Followed and resteemed :)
Hey - just a suggestion - maybe use Steemit examples in a future stats post? Tie it all back together? There are some terrific resources out there that provide all kinds of interesting stats on Steemit - usage stats, user stats, etc., and that might be a fun way to make the examples have some more meaning in this context and drive reader engagement.
OMG thank you! Fantastic idea!!! 😃
This post was resteemed by @resteembot!
Good Luck!
Learn more about the @resteembot project in the introduction post.
Check out the other content resteemed by @resteembot.
Some of it is really cool!
You were lucky! Your post was selected for an upvote!

Read about that initiative
Whatever @resteembot resteems, I resteem too!
I am a new, simple to use and cheap resteeming bot
I will automatically resteem posts resteemed by @resteembot until 2017-09-01 00:00:01 +00:00
If you want to read more about me, read my introduction post.