Burned tokens, rewards, and inflation summary February 4, 2023: 119K SP, 81K STEEM, and 909 SBD burned in 38K burnsteem25 posts
Steemit launched the #burnsteem25 initiative on May 22, and the corresponding rewards started being delivered to @null on May 29. Subsequently, on August 9, Steemit announced that they'd be monitoring post promotions daily. Here is the next weekly update with PowerBI charts to visualize the burned token-related statistics since those dates.
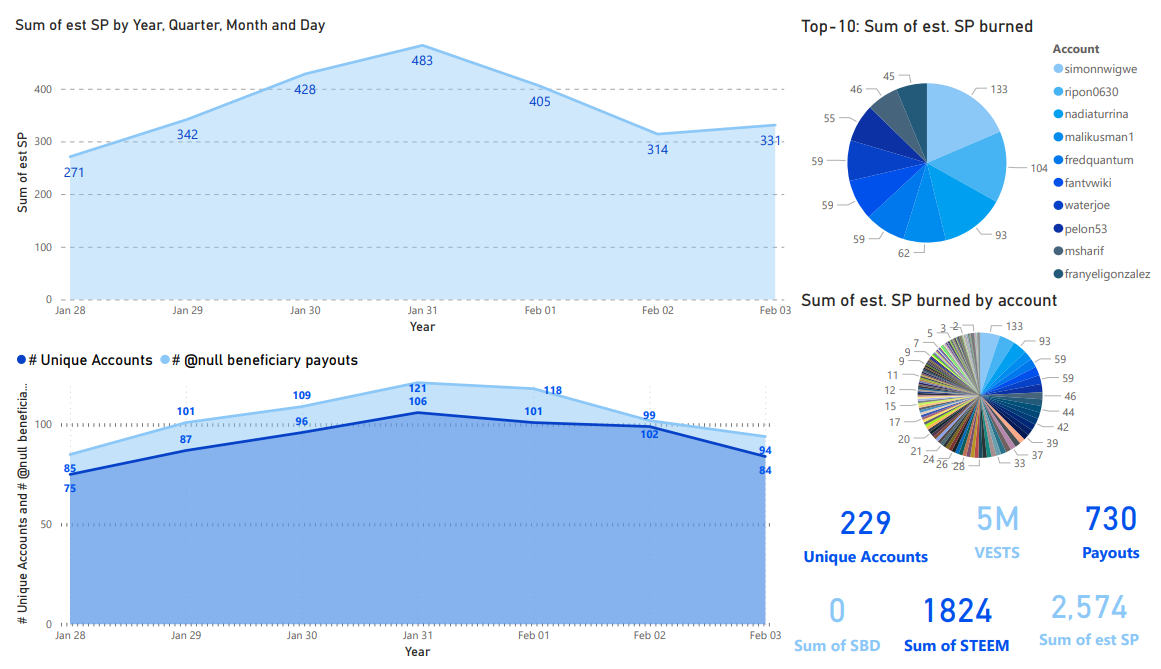
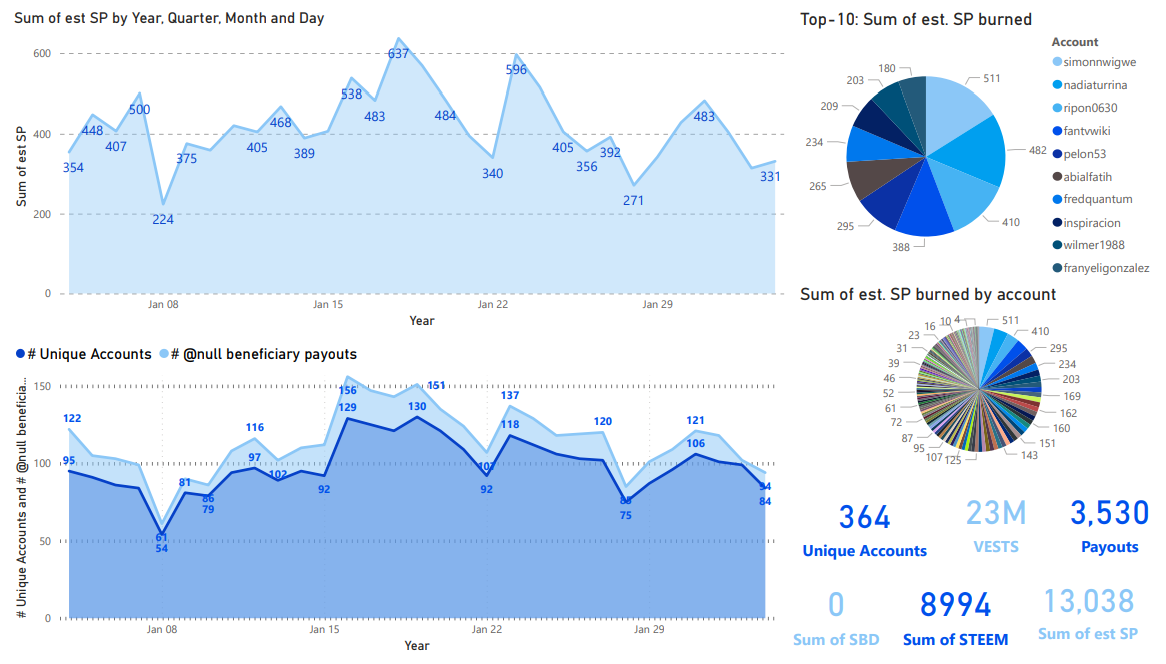
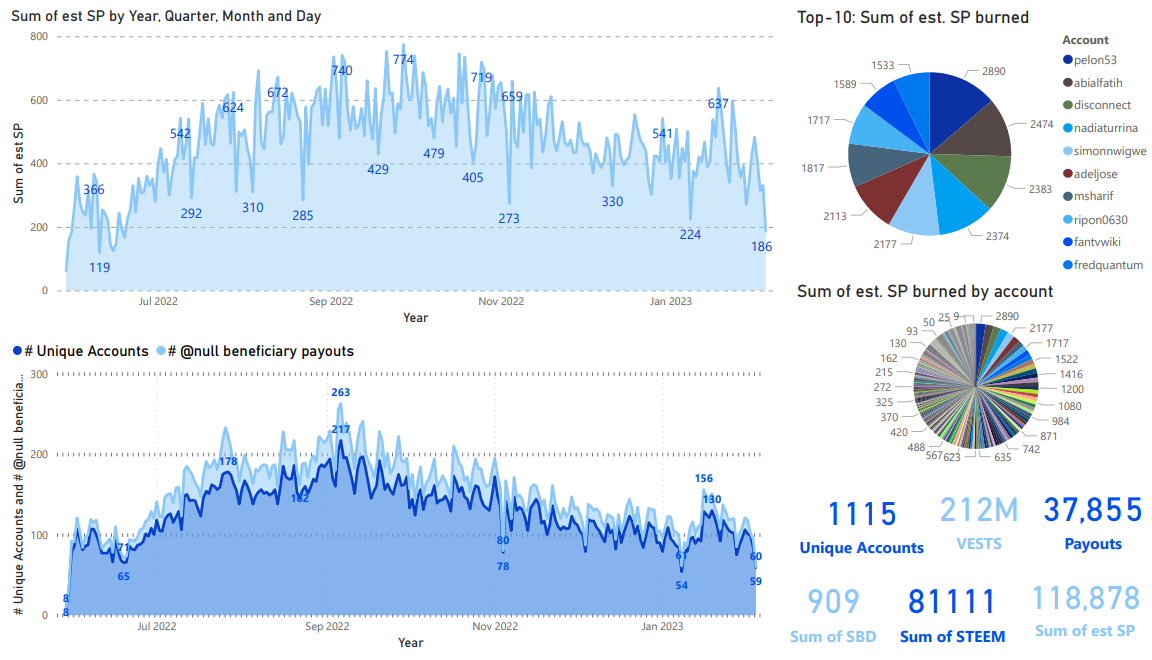
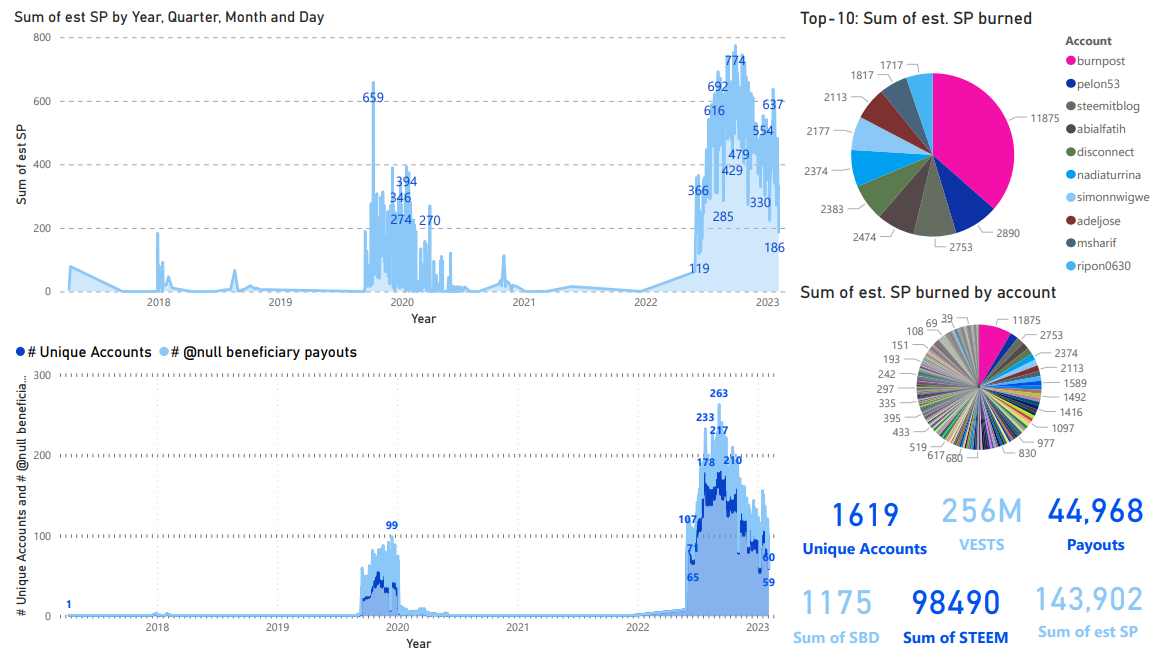
Slide 1 & 2: Burn amounts in beneficiary rewards and transfers to @null. (Weekly & All time)
According to data from steemdb, weekly totals were about 2,561 SP in burned beneficiary rewards and 0.06 SBD burned on promotion with 732 burnsteem25 posts (~3.5 SP burned per post). This is down by 122 from last week's 854 posts. There were no new entries in the all time top-4 list.
The numbers in these slides will differ slightly from the numbers in slides 5 & 7 because of different data sources and collection times.
Weekly
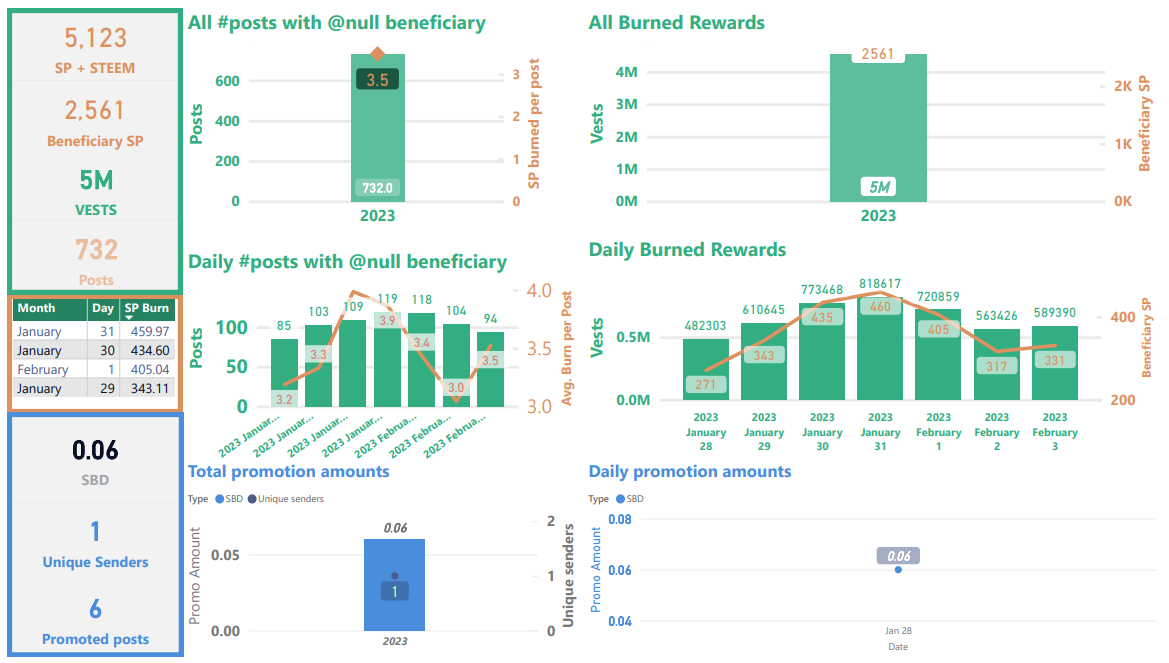
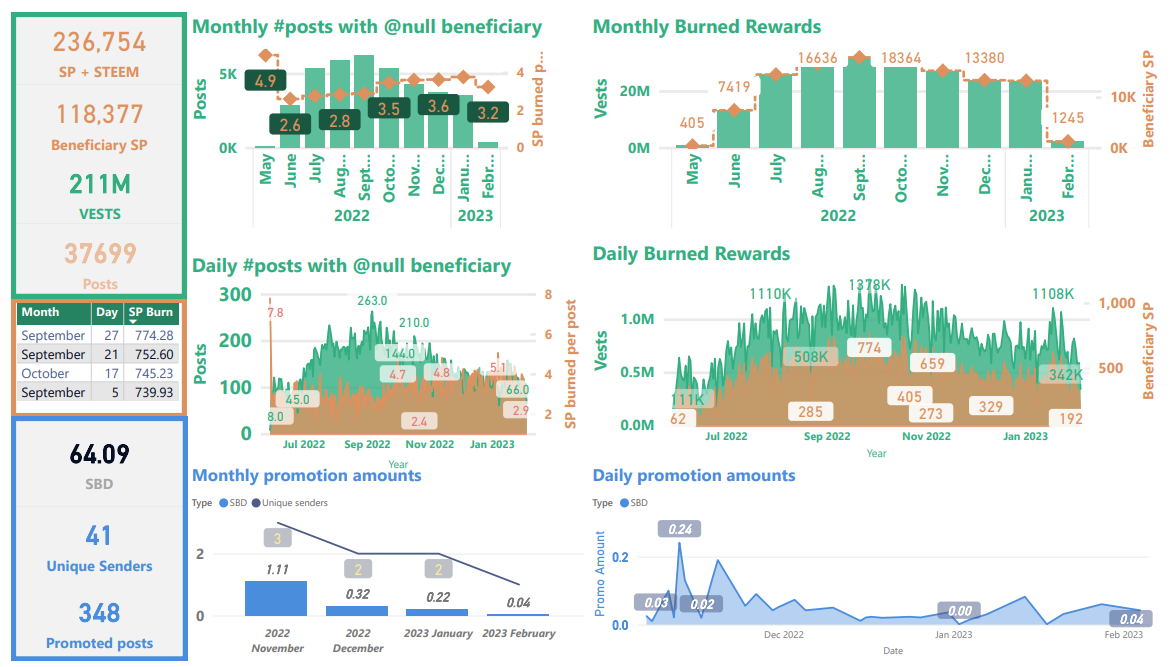
All time
| Sidebars |
|---|
Top sidebar summary cards show total number of STEEM, SP, and VESTS burned, as well as the total number of posts with @null beneficiary settings.
In the center-left sidebar is a new table showing the top-4 days in terms of burned beneficiary rewards.
Bottom-left sidebar summary cards show totals for SBD burned in post promotion.
| Graphs |
|---|
Top-left is a graph showing the number of posts and average SP burned per post by month.
Top-right: This shows the VESTS and the estimated SP beneficiary rewards burned per month.
Middle-left: This is a graph showing the number of posts and average SP burned per post, by day.
Middle-right: This shows the daily VESTS and the estimated SP beneficiary rewards that have been burned.
In all of the above graphs, VESTS are shown against the left axis, SP and STEEM are shown against the right.
Bottom: SBD transfers to @null. As readers are likely aware, SBD transfers to @null can get a post added to the /promoted page. The visualization on the left shows a monthly aggregation of SBDs transferred and a count of unique senders. The visualization on the right shows the daily record.
Slide 3: Rewards summary
Unchanged from the last eighteen weeks is that SBD printing has remained paused due to continuing sluggishness impacting the price of STEEM (and crypto markets at large). With the present SBD supply, it looks like the median on-chain price for STEEM needs to get back to about $0.252 for SBDs to start printing again. The 90 day total of 80.6K burned and 5.04M in overall social rewards yields a rough burn rate of about 1.6%.
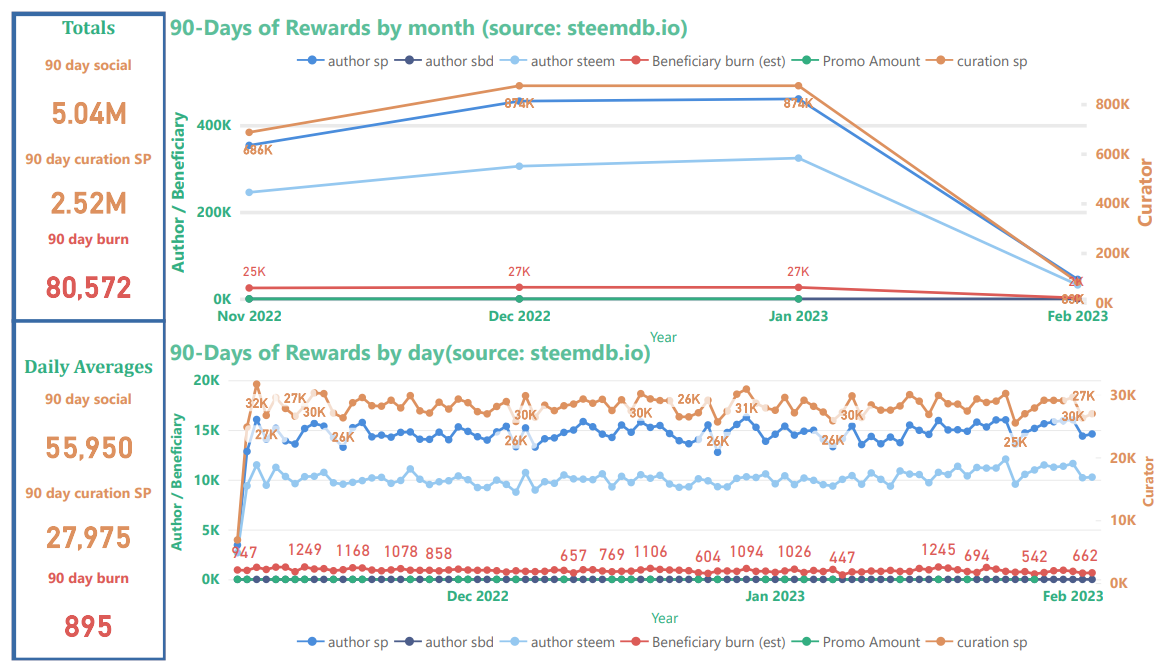
Curator rewards use the scale on the right, author and beneficiary rewards use the scale on the left. Thus, curation rewards appear to be scaled down relative to author & beneficiary rewards. Beneficiary rewards for @null in this chart (red) have been adjusted in order to account for both SP and liquid rewards. The top graph shows the monthly aggregations, and the bottom graph shows daily totals.
The new top-left sidebar shows estimates for the 90-day total of distributed "social rewards" (author, curator, and beneficiary), the 90-day total of curation rewards; and the 90-day total of burned beneficiary rewards.
The new bottom-left sidebar shows estimated daily 90-day averages for the same three values. In both sidebars, "social rewards" are calculated as [curation rewards] * 2. Based on these estimates, the burn rate is about 1.9% of all social rewards (this excludes interest paid for staking, rewards to witnesses, and SBDs to the SPS).
Slide 4: STEEM & SBD Supply as well as vested (i.e. staked or "powered up") STEEM
Noteworthy this week is that liquid STEEM as a percentage of current supply and of virtual supply reversed direction again with a weekly decrease and a sharp decrease for the day (top-right and bottom-left charts). Also, the current blockchain inflation rate is now running around 6.80%, which is the same as last week, down from 6.89% when I started tracking it on November 26, 2022. 6.80% is the lowest I've seen since I started tracking the value.
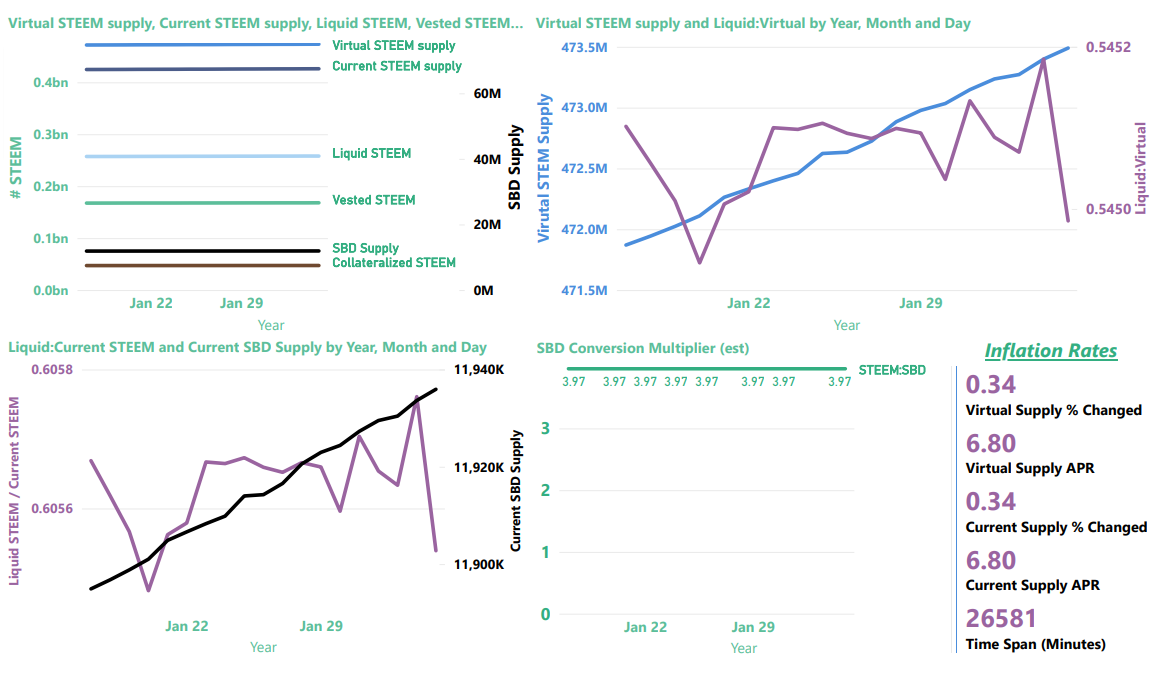
The card in the lower-right corner shows the inflation rates for current_supply and virtual_supply, as calculated from the SteemDB API.
The top-left image provides a summary view of current and virtual STEEM supply, current SBD supply, liquid and vested STEEM, and the amount of STEEM reserved as collateral for paying off SBDs.
| Note |
|---|
Collateralized STEEM and current SBD supply actually represent the same value expressed in terms of STEEM or SBDs, respectively. They're aligned differently on the graph because they use different axes. |
The top-right graphic now contains a zoom-in on "virtual STEEM Supply" (left axis) and the ratio of liquid STEEM / virutal STEEM supply (right axis). As we learned, here, virtual STEEM supply is heavily influenced by price, so with STEEM prices down, it's not surprising to find the virtual STEEM supply increasing. The up-side of this is that it's now possible to burn more collateralized STEEM per SBD with post promotion.
The bottom-left visualization now contains the ratio of liquid STEEM / current STEEM supply (left axis) and a zoom-in on Current SBD supply (right axis)
The chart on the bottom right shows the value of SBDs in terms of STEEM, according to the blockchain conversion rate, not external markets. This is the inverse of the blockchain's: internal price (which is different from the actual feed median, for reasons that I don't currently understand).
Now, here are some more details about each of the values
| Parameter | Axis (left/right) | Meaning | Comments |
|---|---|---|---|
| SBD Supply | right | Number of SBDs in circulation | Equivalent in value to collateralized STEEM |
| Collateralized STEEM | left | Number of STEEM needed to pay off all SBD debt | Equivalent in value to SBD Supply |
| Vested STEEM | left | Number of STEEM staked as STEEMPOWER | |
| Liquid STEEM | left | Number of STEEM that's not staked or needed for SBD collateral | Calculated as (Current STEEM supply - Vested STEEM) |
| Current STEEM supply | left | Number of STEEM in circulation | |
| Virtual STEEM supply | left | Number of STEEM in existence |
Slide 5-8
Instead of using steemdb.io, here are the newer visualizations - straight from the blockchain's API. These cover the last week, the last month, the full burnsteem25 era, and throughout the entire blockchain's lifetime.
Last week
Last month
May 29 to present (The burnsteem25 era)
All time
Thanks for reading!
Previous weeks
- Burned tokens, rewards, and inflation summary January 28, 2023: 116K SP, 79K STEEM, and 909 SBD burned in 37K burnsteem25 posts
- Burned tokens, rewards, and inflation summary January 21, 2023: 113K SP, 77K STEEM, and 909K SBD burned in 36K burnsteem25 posts
- Burned tokens, rewards, and inflation summary January 14, 2023: 110K SP, 75K STEEM, and 909K SBD burned in 35K burnsteem25 posts
- Burned tokens, rewards, and inflation summary January 7, 2023 - Total burn estimates: 213K STEEM/SP and 64 SBD
For links to updates from 2022, see:
Pixabay license, source
Reminder
Visit the /promoted page and #burnsteem25 to support the inflation-fighters who are helping to enable decentralized regulation of Steem token supply growth.
Theoretically, the burning of tokens leads to an increase in prices for the remaining coins in circulation. In practice, this only works if the token is in demand on the market, and the project enjoys a good reputation. And our coin is in good demand.
To me, the reason for burning coins has to be about blog visibility and not token value. Even if(?) it does effect the price, generally the people doing the burning aren't the people who would benefit from the price change, so there has to be a different benefit for the people who do it.
Basically, I see it as a way to promote a blog post, in hopes of expanding an author's audience.
From what I read, every day there are fewer users burning their steem, I understand the graphs very little, but the arrows down indicate that this week the burning of steem did not go very well, although its price remains stable at the moment.
Yes, it has been declining for a while. I don't know if that corresponds with a general decline in usage or not.
I think the same.
I think that many users will think why burn my token if it is very difficult for me to earn it, of course we are talking about users who earn little per publication. Token burning should be applied to large accounts that tend to drain large amounts of steem on a daily basis.
This post has been featured in the latest edition of Steem News...
Many thanks for the analysis and work! Interest this week has been pretty low.
Analysis at the highest level! I keep track of the burnt coins, and in general, the situation with the cryptocurrency as a whole. Burning coins bear fruit, the price does not fall much for a long time.
I wish you a happy day
Thanks! And I hope the same for you.