Burned tokens, rewards, and inflation summary January 21, 2023: 113K SP, 77K STEEM, and 909K SBD burned in 36K burnsteem25 posts
Steemit launched the #burnsteem25 initiative on May 22, and the corresponding rewards started being delivered to @null on May 29. Subsequently, on August 9, Steemit announced that they'd be monitoring post promotions daily. Here is the next weekly update with PowerBI charts to visualize the burned token-related statistics since those dates.
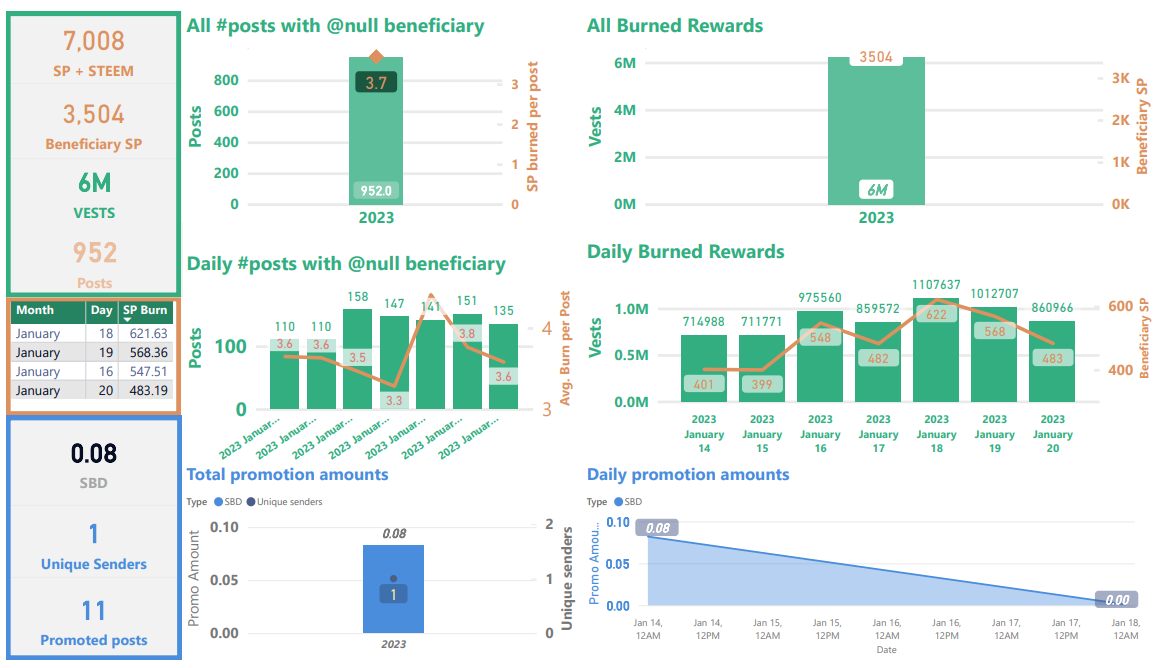
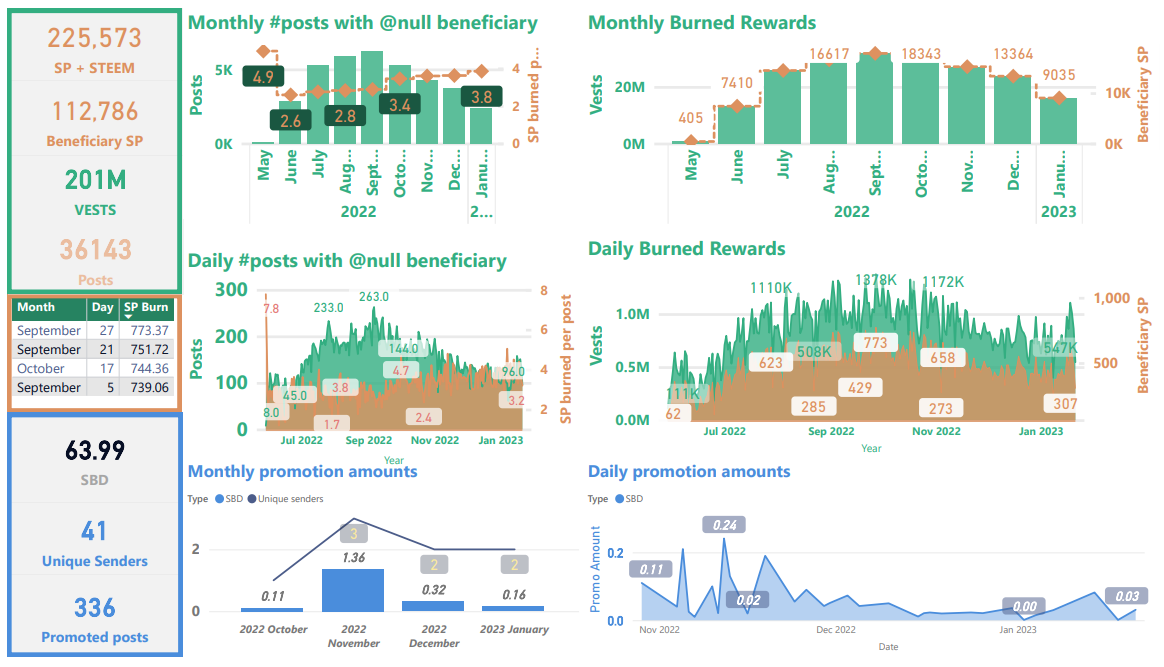
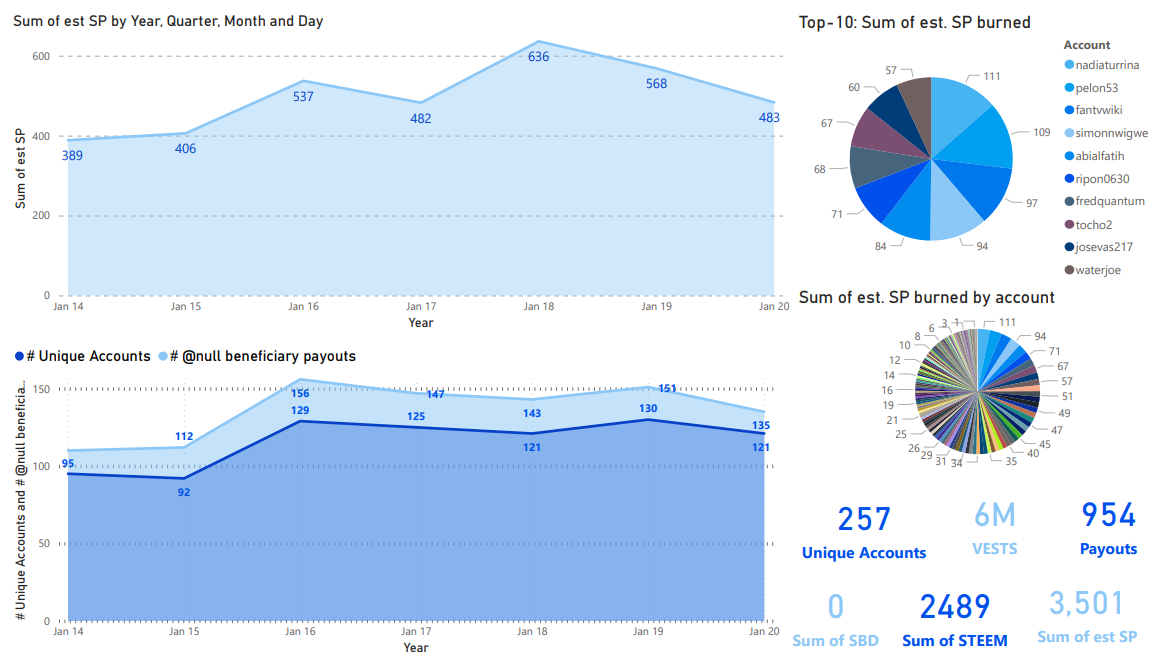
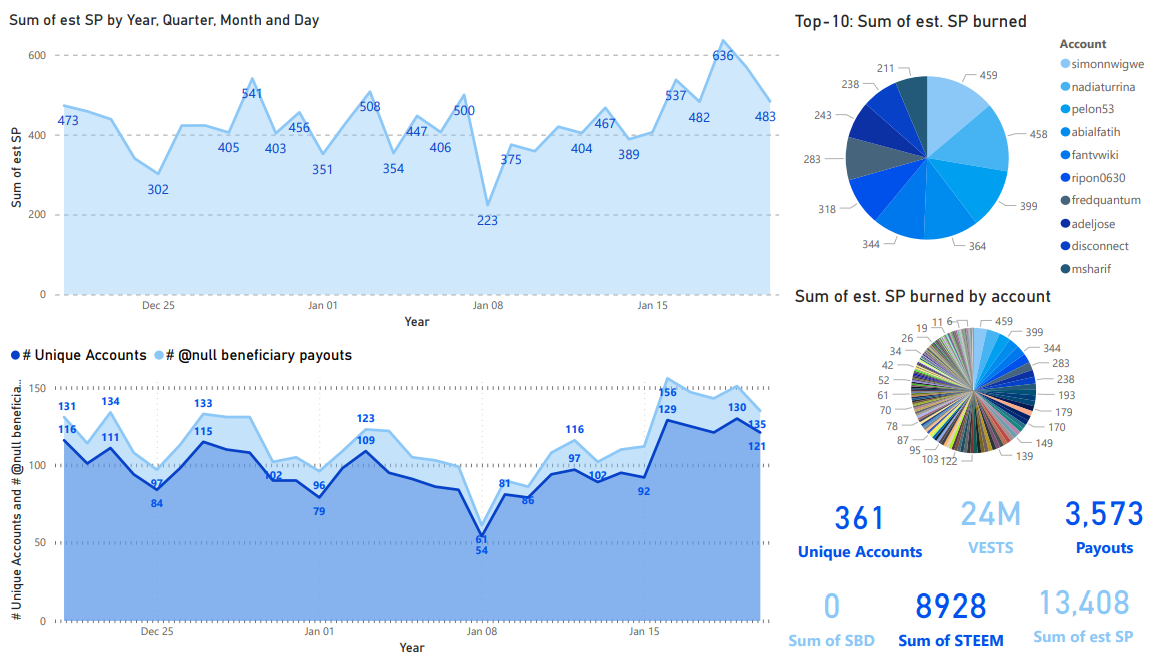
Slide 1 & 2: Burn amounts in beneficiary rewards and transfers to @null. (Weekly & All time)
According to data from steemdb, weekly totals were about 3,504 SP in burned beneficiary rewards and 0.08 SBD burned on promotion with 952 burnsteem25 posts (~3.7 SP burned per post). This is up by 292 from last week's 660 posts. There were no new entries in the all time top-4 list.
The numbers in these slides will differ slightly from the numbers in slides 5 & 7 because of different data sources and collection times.
Weekly
All time
| Sidebars |
|---|
Top sidebar summary cards show total number of STEEM, SP, and VESTS burned, as well as the total number of posts with @null beneficiary settings.
In the center-left sidebar is a new table showing the top-4 days in terms of burned beneficiary rewards.
Bottom-left sidebar summary cards show totals for SBD burned in post promotion.
| Graphs |
|---|
Top-left is a graph showing the number of posts and average SP burned per post by month.
Top-right: This shows the VESTS and the estimated SP beneficiary rewards burned per month.
Middle-left: This is a graph showing the number of posts and average SP burned per post, by day.
Middle-right: This shows the daily VESTS and the estimated SP beneficiary rewards that have been burned.
In all of the above graphs, VESTS are shown against the left axis, SP and STEEM are shown against the right.
Bottom: SBD transfers to @null. As readers are likely aware, SBD transfers to @null can get a post added to the /promoted page. The visualization on the left shows a monthly aggregation of SBDs transferred and a count of unique senders. The visualization on the right shows the daily record.
Slide 3: Rewards summary
Unchanged from the last sixteen weeks is that SBD printing has remained paused due to continuing sluggishness impacting the price of STEEM (and crypto markets at large). With the present SBD supply, it looks like the median on-chain price for STEEM needs to get back to about $0.252 for SBDs to start printing again. The 90 day total of 85K burned and 5.03M in overall social rewards yields a rough burn rate of about 1.7%.
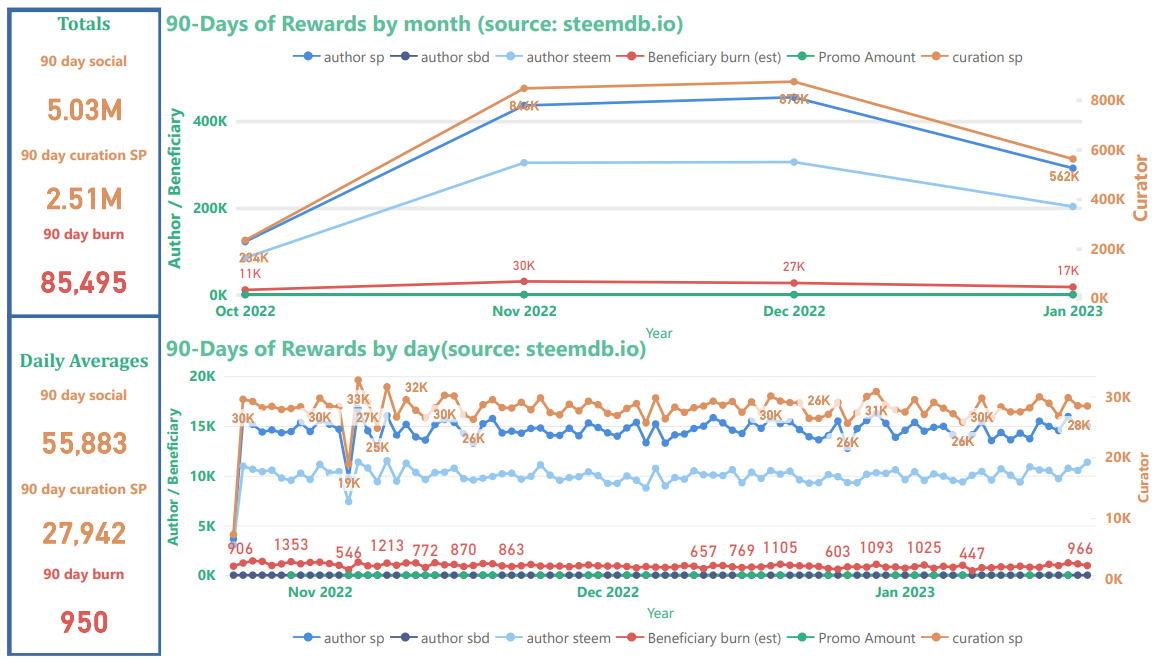
Note that we could reduce the SBD supply by 1,000 per day if the "Reduced inflation proposal" proposal gets enough votes to go above the return proposal. That would lower the STEEM price needed for SBDs to start being issued to authors again by reducing the percentage of outstanding debt.
Curator rewards use the scale on the right, author and beneficiary rewards use the scale on the left. Thus, curation rewards appear to be scaled down relative to author & beneficiary rewards. Beneficiary rewards for @null in this chart (red) have been adjusted in order to account for both SP and liquid rewards. The top graph shows the monthly aggregations, and the bottom graph shows daily totals.
The new top-left sidebar shows estimates for the 90-day total of distributed "social rewards" (author, curator, and beneficiary), the 90-day total of curation rewards; and the 90-day total of burned beneficiary rewards.
The new bottom-left sidebar shows estimated daily 90-day averages for the same three values. In both sidebars, "social rewards" are calculated as [curation rewards] * 2. Based on these estimates, the burn rate is about 1.9% of all social rewards (this excludes interest paid for staking, rewards to witnesses, and SBDs to the SPS).
Slide 4: STEEM & SBD Supply as well as vested (i.e. staked or "powered up") STEEM
Noteworthy this week is that liquid STEEM as a percentage of current supply and of virtual supply decreased for the first time after a 3 week up-trend (top-right and bottom-left charts). Also, the current blockchain inflation rate is now running around 6.81%, which is down from last week's 6.84% and from 6.89% when I started tracking it on November 26, 2022.
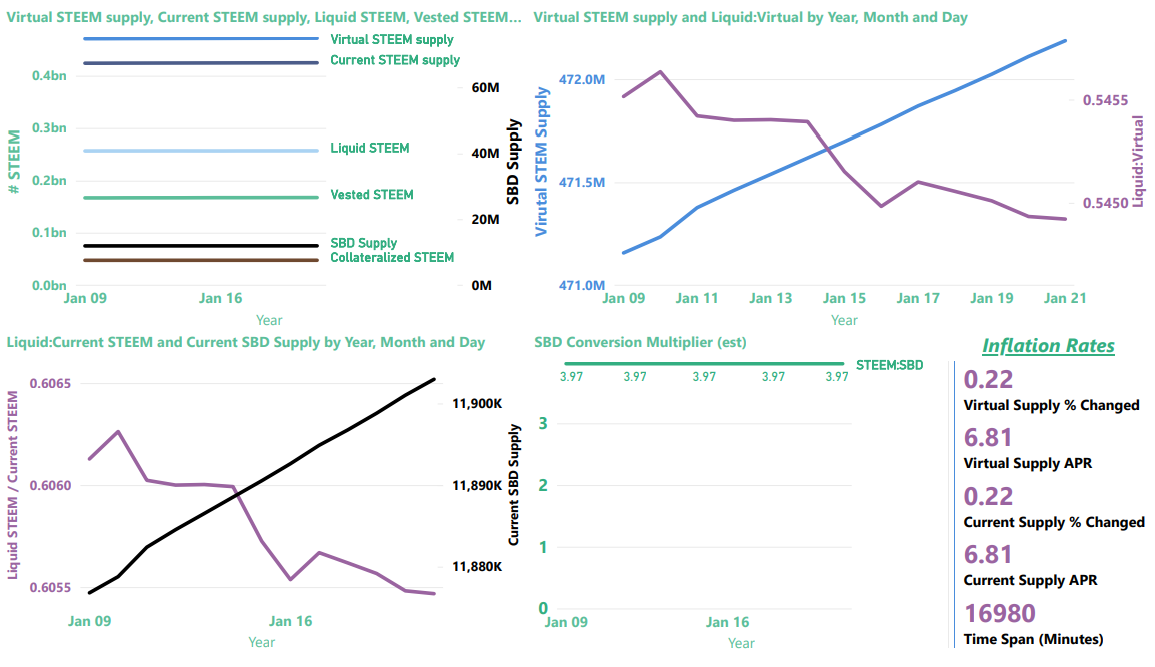
The card in the lower-right corner shows the inflation rates for current_supply and virtual_supply, as calculated from the SteemDB API.
The top-left image provides a summary view of current and virtual STEEM supply, current SBD supply, liquid and vested STEEM, and the amount of STEEM reserved as collateral for paying off SBDs.
| Note |
|---|
Collateralized STEEM and current SBD supply actually represent the same value expressed in terms of STEEM or SBDs, respectively. They're aligned differently on the graph because they use different axes. |
The top-right graphic now contains a zoom-in on "virtual STEEM Supply" (left axis) and the ratio of liquid STEEM / virutal STEEM supply (right axis). As we learned, here, virtual STEEM supply is heavily influenced by price, so with STEEM prices down, it's not surprising to find the virtual STEEM supply increasing. The up-side of this is that it's now possible to burn more collateralized STEEM per SBD with post promotion.
The bottom-left visualization now contains the ratio of liquid STEEM / current STEEM supply (left axis) and a zoom-in on Current SBD supply (right axis)
The chart on the bottom right shows the value of SBDs in terms of STEEM, according to the blockchain conversion rate, not external markets. This is the inverse of the blockchain's: internal price (which is different from the actual feed median, for reasons that I don't currently understand).
Now, here are some more details about each of the values
| Parameter | Axis (left/right) | Meaning | Comments |
|---|---|---|---|
| SBD Supply | right | Number of SBDs in circulation | Equivalent in value to collateralized STEEM |
| Collateralized STEEM | left | Number of STEEM needed to pay off all SBD debt | Equivalent in value to SBD Supply |
| Vested STEEM | left | Number of STEEM staked as STEEMPOWER | |
| Liquid STEEM | left | Number of STEEM that's not staked or needed for SBD collateral | Calculated as (Current STEEM supply - Vested STEEM) |
| Current STEEM supply | left | Number of STEEM in circulation | |
| Virtual STEEM supply | left | Number of STEEM in existence |
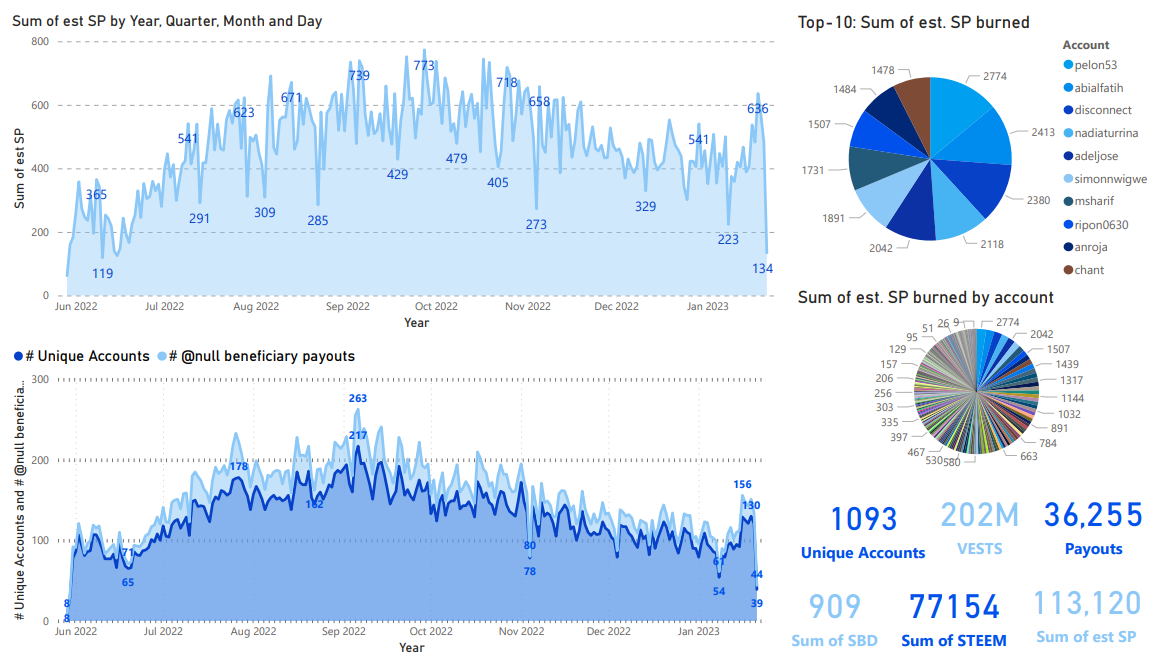
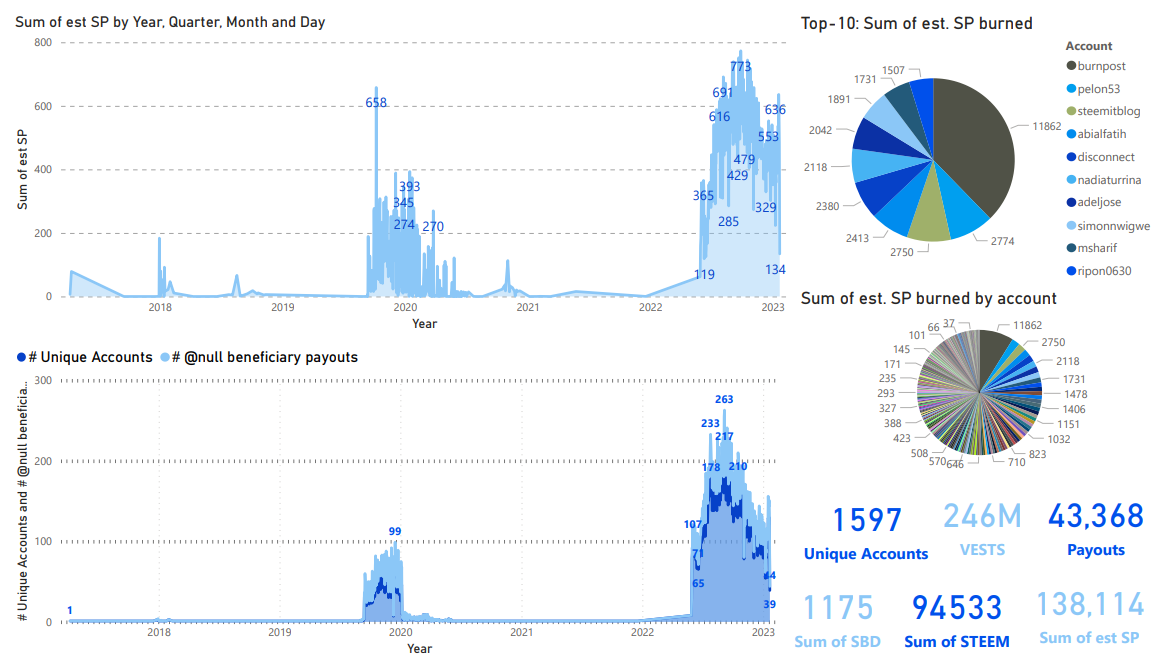
Slide 5-7
Instead of using steemdb.io, here are the newer visualizations - straight from the blockchain's API. These cover the last week, the last month, the full burnsteem25 era, and throughout the entire blockchain's lifetime.
Last week
Last month
May 29 to present (The burnsteem25 era)
All time
Last week, I asked, "Do you think @pelon53 will catch @steemitblog before February?" It happened in just 1 week.
Thanks for reading!
Previous weeks
- Burned tokens, rewards, and inflation summary January 14, 2023: 110K SP, 75K STEEM, and 909K SBD burned in 35K burnsteem25 posts
- Burned tokens, rewards, and inflation summary January 7, 2023 - Total burn estimates: 213K STEEM/SP and 64 SBD
For links to updates from 2022, see:
Pixabay license, source
Reminder
Visit the /promoted page and #burnsteem25 to support the inflation-fighters who are helping to enable decentralized regulation of Steem token supply growth.
Thanks, friend @remlaps-lite for the mention, I will continue to support this initiative, to see some improvement in Steem pricing in the coming months.
This post has been featured in the latest edition of Steem News...
Of course, we will continue to monitor the price of steem. I am pleasantly shocked that the coin went up in spite of. And Bitcoin is going up. Although if you look at the analytics, bitcoin always reaches its peak of growth by spring. Fingers crossed, we will continue to watch!
Good analysis, good incentive. Thanks for this. The amount of burning this week seems a little low compared to other weeks.
Yeah, it rebounded a little bit, but it seems like it has been trending down in recent weeks, along with the STEEM price.
I recently used the hashtag #burnsteem25 soon I will use it more often when I have tokens to burn 😁 When my posts are voted frequently I will activate that tag.
Oh, it's a pity that SBD has not been charged for a long time. In one of your statistics, you gave a plan of action to resume printing this coin. I am glad that steam remains afloat. And bitcoin is growing slowly upwards. I remember how the first bitcoin holder bought a pizza for 1 bitcoin)))
I wish you a happy day