Bitcoin Trend Series / EP. 667 / The Next Station 6.300K
Time: 8.00 A.M. / GM+2 / 8th Aug 2018 – Wed.
Recapitulatin
- Technically our major weekly target stands at 4.444K, the butterfly target, that we've mentioned in our post / 648 / !
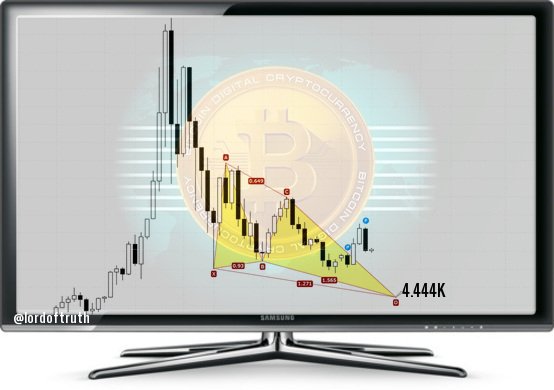
Fundamentally, we've estimated that Bitcoin Breakeven Mining Expense stands around 5500$/BTC, in our post / 653 / !
It means that the 5.500K level is the Fundamental Barrier, the reason why we believe that bitcoin price will be difficult to test 4.444K! But if the price technically pass the 5.500K, bitcoin price hardly will hold below the fundamental barrier for too long.
Market Factors
Most of the last Decline to 6.551K has been blamed on FUD that led traders to dump their holdings, leading to even more losses for bitcoin price as sellers keep piling in.
There seem to be no major positive updates that could stop the bleeding, but many are pointing to the consistent market dominance
of bitcoin even while the industry is in Selloff Mode!DEA Use Blockchain Analysis to Identify Those Using Bitcoin for Illegal Purposes. According to a DEA agent, far more Bitcoin is being used for speculation than to facilitate crimes. Full Article !
Technical
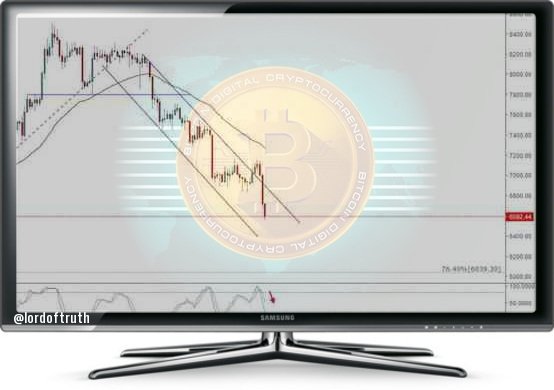
In our previous post / 666 / we had forecast the trading range will be between 6.500K & 7.500K. The intraday low was 6.551K and the high was 7.150K.
Bitcoin price showed some bullish bias and tested 7.150K, but as expected, bitcoin price returned to the Bearish Channel, shown on the below 4H chart, to resumes its bearish bias within this bearish channel, supported by EMA50, trying to test the 6.300K Level.
RSI reflect exhaustion among bears. Stochastic signal that sellers might take a break. Oscillators indicate a return in bullish pressure.
Keep an Watching Eye on 6.300K, because if the price hold around 6.300K, bitcoin price could recover toward 7.500K, where we should get chance to go short with another large leg down! While a clear break under 6.300K will be so ugly.
Sentiment
Support 1: 6300.000 level.
Resistance1 : 6900.00 level.
Support 2: 6039.000 level.
Resistance2 : 7150.000 level.
Expected trading for today:
is between 6039.00 and 6900.00.
Expected trend for today :
Bearish.
Medium Term:
Neutral.
Long Term:
Bullish.
The low of 2018:
5782.000
The high of 2018 (BitcoinTrader's Year):
14469.00 / Expected.
The low of 2019: ???
The high of 2019 (Bitcoin Holder's Year):
36000.00 level / Expected.

investing considerable time and effort up front in
hopes of considerable returns down the road.
I'm so proud of my little blog, and so grateful to all of you
for support to keep it going.

Well seems like the prediction of earlier low might be possible