BTC Market Watch
Lets take a look at what BTC is doing today.
Lets start off with an AB=CD pattern on the daily chart.
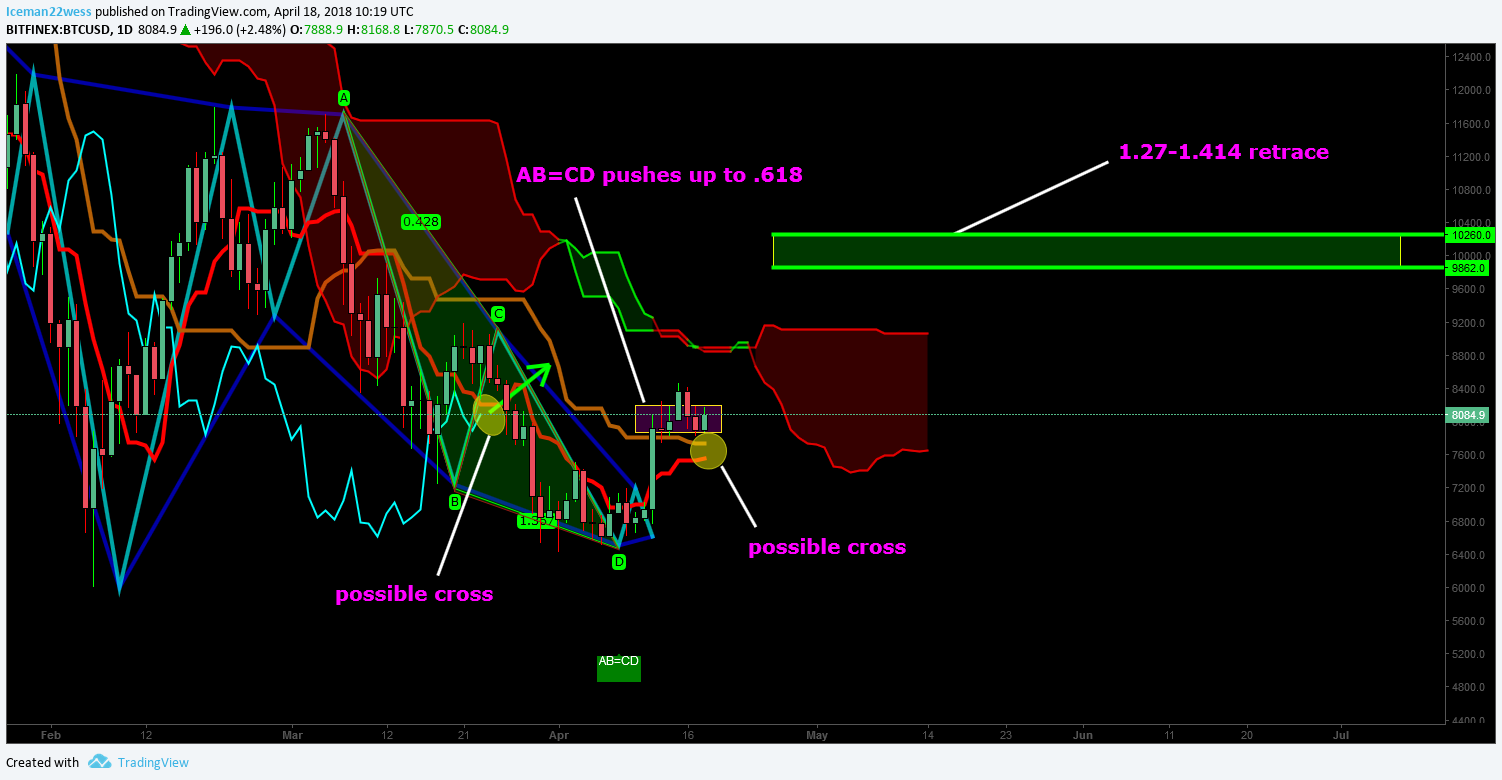
Daily charts are already far and few between to find patterns on. Here we have an AB=CD pattern that is based on trend. While it is possible that the pattern has already completed, shown by the purple box indicating some sideways around the .618 retrace. Furthermore, patterns that trade against the trend tend to stall out around the .618, while patterns that trade with the trend can spike all the way up the the 1.27-1.414. I've marked where that is with the green box, but it is far too optimistic to realistically think the price would go there without further signals to go off of. For example, if we can see the trailing line or the base and conversion line cross (marked by yellow circles), we could very well see a strong push into the red cloud.
Overall, the daily chart, while showing a very bullish pattern, is too dangerous to trade this late into the pattern, because it is against the trend.
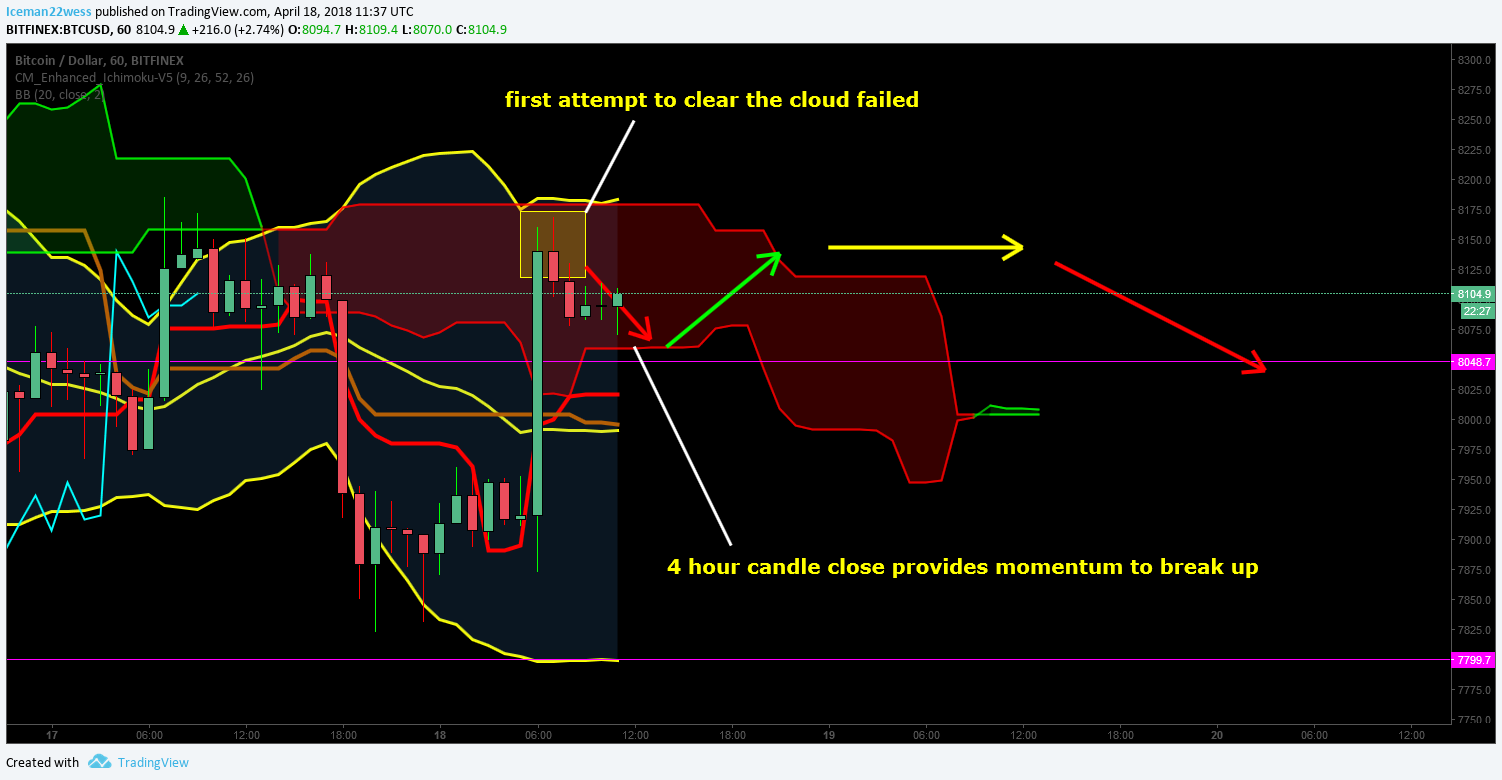
Next lets take a look at the 4 hour chart
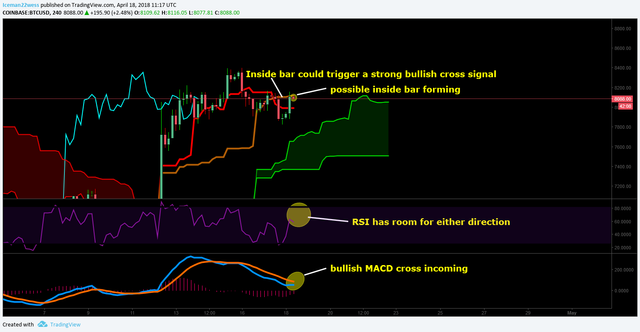
Here we see a bullish inside bar. The last inside bar failed, mostly on the back of the base and conversion line crossing bearish. As in my last post about BTC, I expected to attempt to ride the top of the green cloud, and eventually fail and fall through it. I am still of this opinion, but if you are looking to go short, the price may spike up another time to give you an even better price to go short at. The RSI has room to go up, and we have a bullish MACD cross very possible. Combine that with a bullish inside bar, trailing line cross and the base and conversion line crossing bullish, we can very well push up again before falling through the cloud.
Lets take a look at where the price could realistically go to.
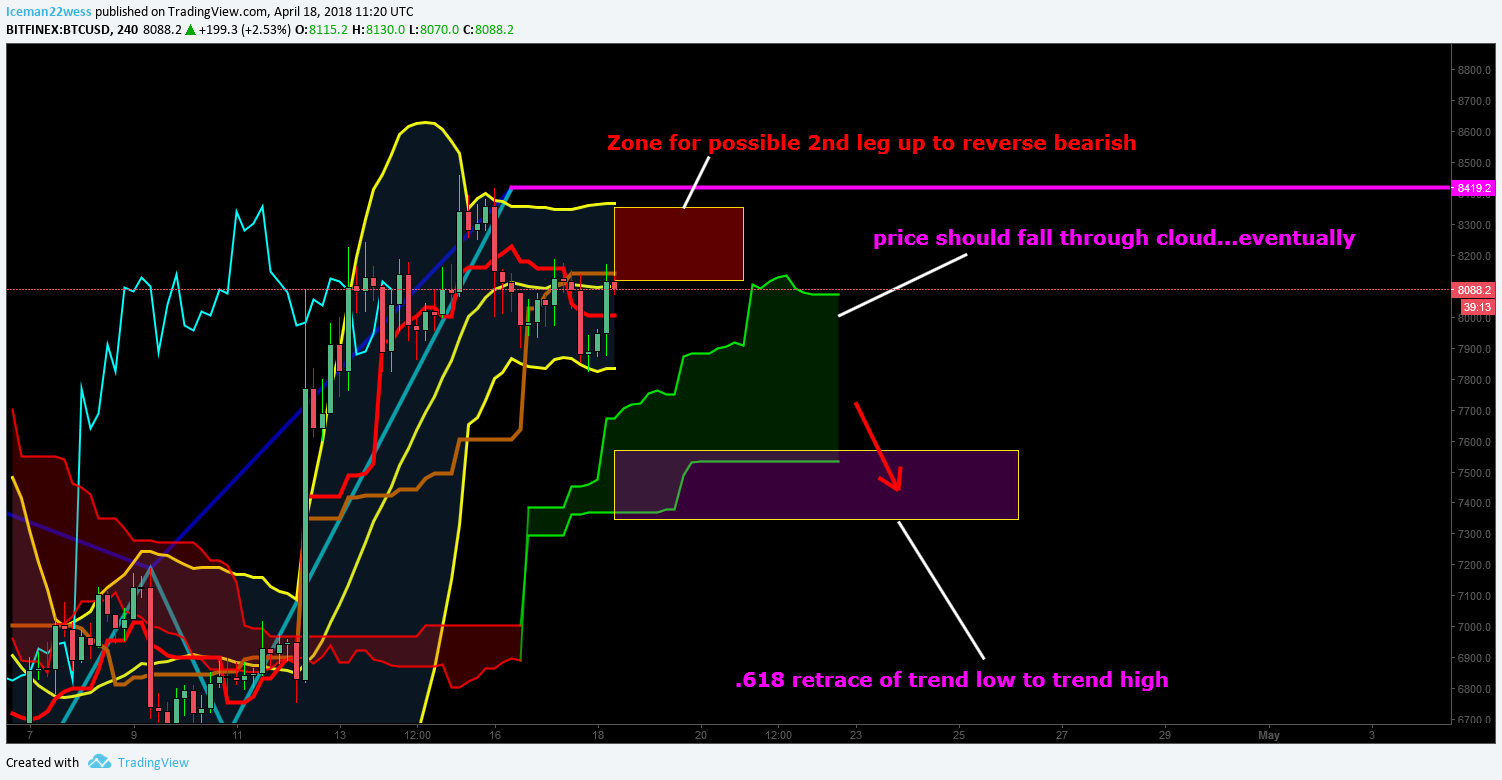
Using the BB's as a general idea, the upper band would limit any price action to no greater than the 8400 area. I suspect that the price won't test quite that high though. Reaching 8200-8250 is a very nice middle ground to target here. If that were to come to pass it would validate a nice AB=CD pattern as shown below.
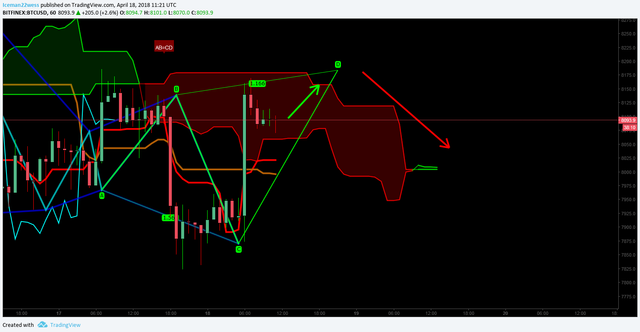
Why could the price go there? the inside bar on the 4 hour closing bullish could help the following chart clear it's red cloud.
Overall, I am extremely bearish. The price needs to come down considerably at some point, and the 4 hour candle is 20 minutes from closing, and if it does not close as a bullish inside bar, it will bring the bearish moves faster than I originally thought. That being said, that doesn't mean that the price can't shoot up from here higher before coming down, which is what the main point of this article was to show. Go short, or wait and then go short, good luck!
Thanks for reading,
-ICE-
Please leave me an upvote and remember, this is not trading advice.
Great round up again, thank you.
thank you for reading it, friend
Thanks for the update!
Resteemed by @resteembot! Good Luck!
Curious? Read @resteembot's introduction post
Check out the great posts I already resteemed.
ResteemBot's Maker is Looking for Work
Resteemed by @resteembot! Good Luck!
Curious? Read @resteembot's introduction post
Check out the great posts I already resteemed.
ResteemBot's Maker is Looking for Work
You were lucky! Your post was selected for an upvote!

Read about that initiative
Resteemed by @resteembot! Good Luck!
Curious? Read @resteembot's introduction post
Check out the great posts I already resteemed.
ResteemBot's Maker is Looking for Work
Resteemed by @resteembot! Good Luck!
Curious? Read @resteembot's introduction post
Check out the great posts I already resteemed.
ResteemBot's Maker is Looking for Work