Bitcoin TA - summary of analysts - 17. May 18
Regular daily update on BTC ta analysts opinions.

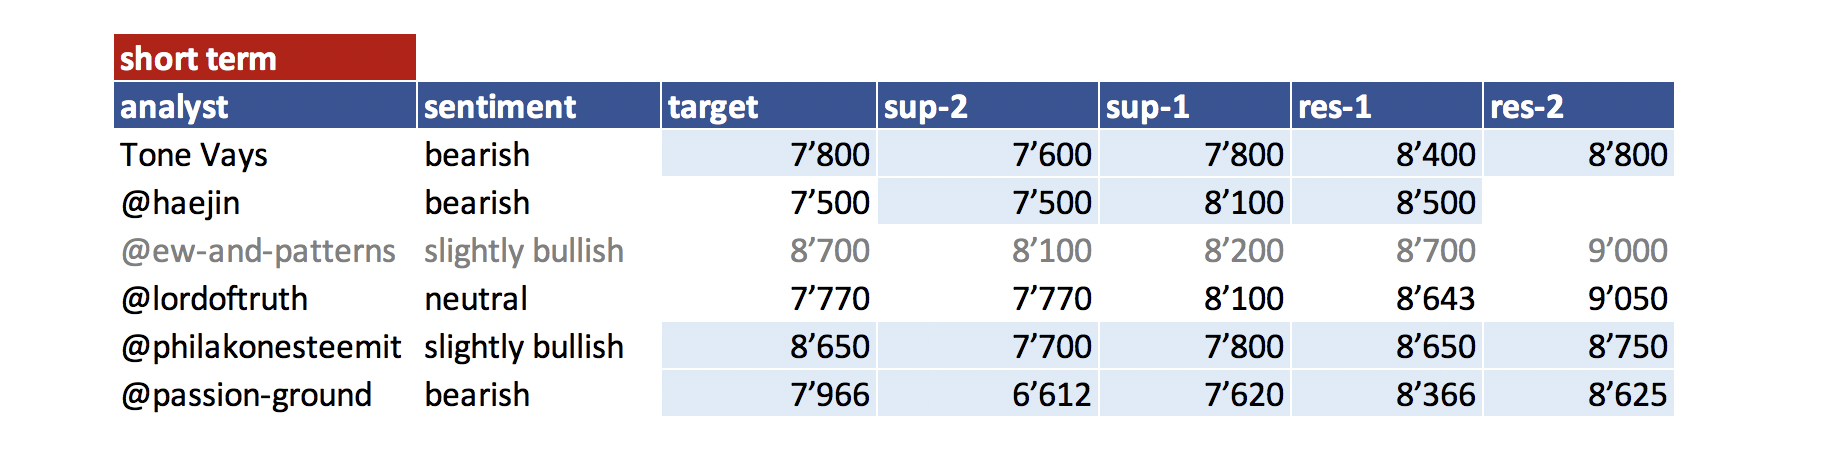
**My summary - short-term sentiment: bearish ** (last: bearish)

Found support for the moment 8'100.
Still more downside expected by most analysts. 7'700 - 7'500 is expected.
Some analysts see a possible move up from here. Critical levels to watch 8'650 - 9'250. If this is broken bullish momentum is taking over.
May is usually a strong month. Lets see how it plays out in 2018.

News about the blog
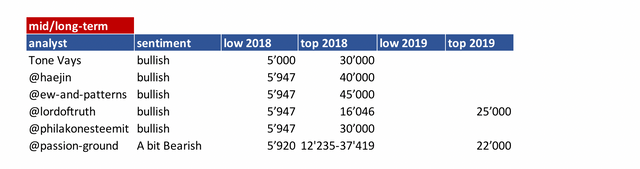
I need to revise my 2018 long term table. I need to add a 2018 and 2019 target an be more precise on the sentiment here. Will do that after I am back in Switzerland.
We lunched the bounty project beta. If you are interested and you like to create a bounty on your own have a look at this post
Analysts key statements:
Tone:
- Weekly: We have a price flip - neutral. No consensus pump at all.
We are trading below 30 MA which is bad. We start trading below 7 MA wich is bad. We are approaching 50 MA but he doesn't think it will hold. He expects it to break in June and for July he expects prices below 6'000 to come. - Daily: He is not expecting a retest of the 8'800 as this happened already in his view. So he is expecting btc to go lower from here.
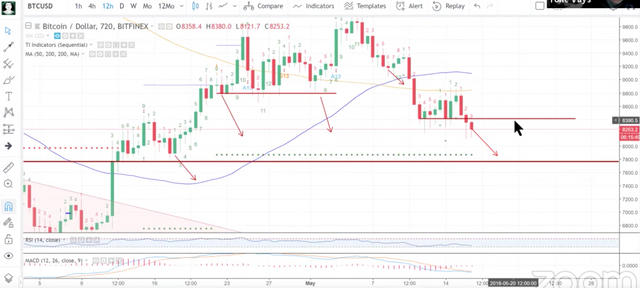
- 12h: The support at 8'400 is broken an he is expecting down move to accelerate to 7'800-7'600 find support and bounce us to 8'400.
@haejin:
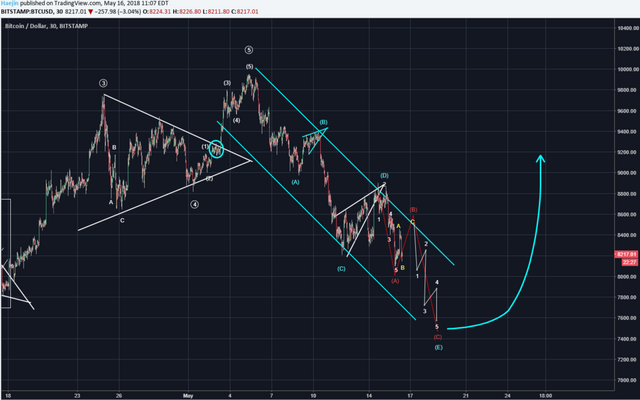
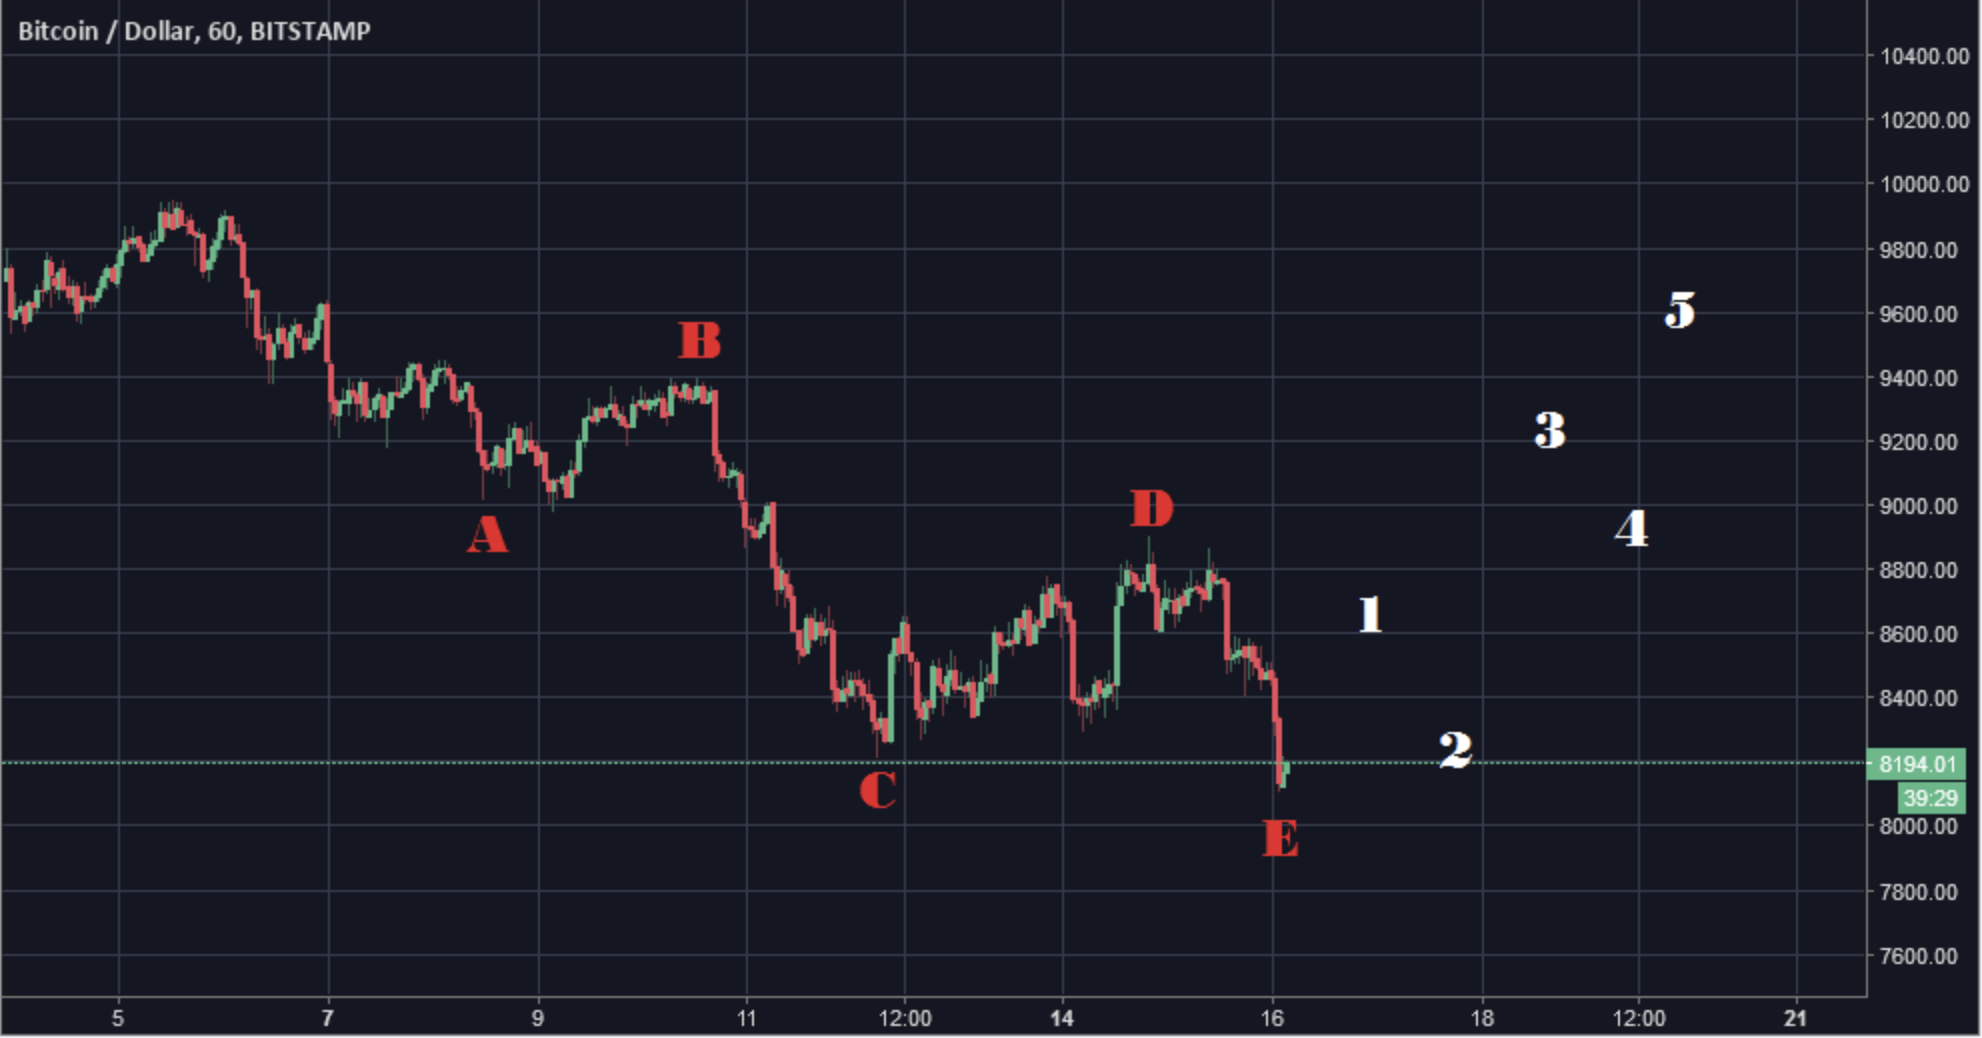
longer term perspective: Cup & Handle is still in progress. As soon as the red E wave is complete, a trend reversal is expected.
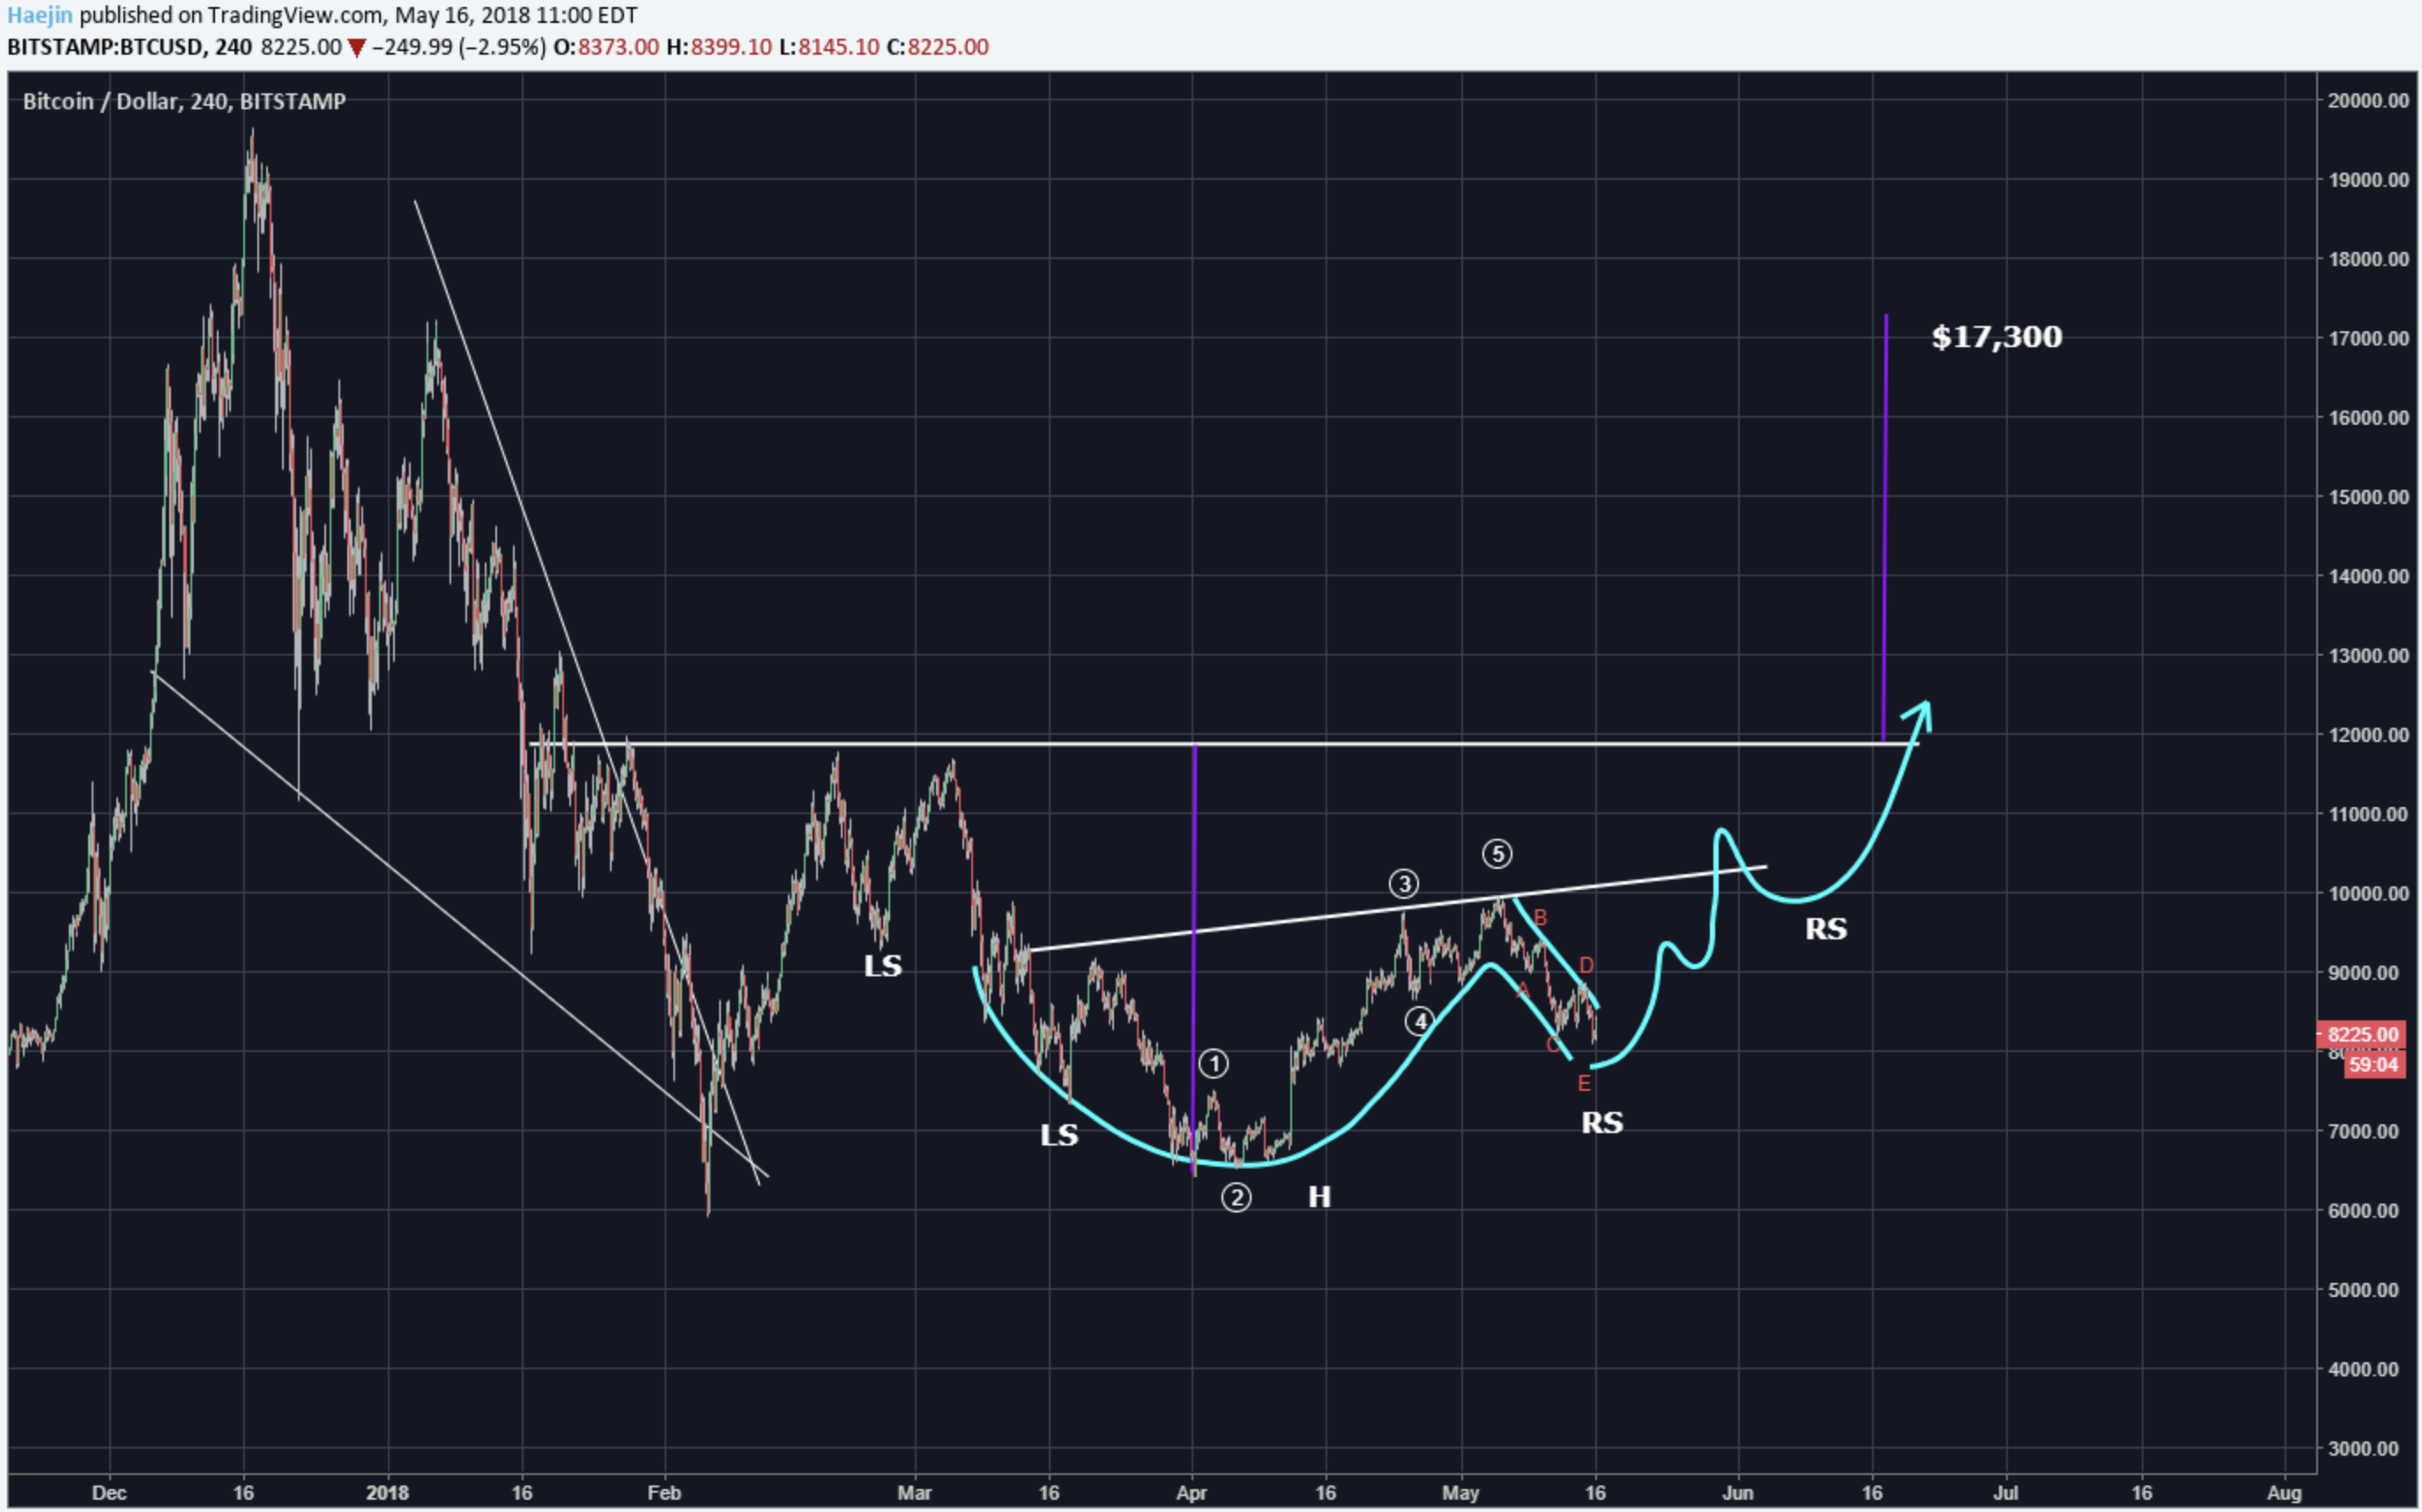
The short term shows that there was a bounce. The yellow ABC are the subwaves of the red B. If yellow A is complete and B is nearly so yellow C wave bounce is expected next. That would complete the red B and so C would onset.
@ew-and-patterns:

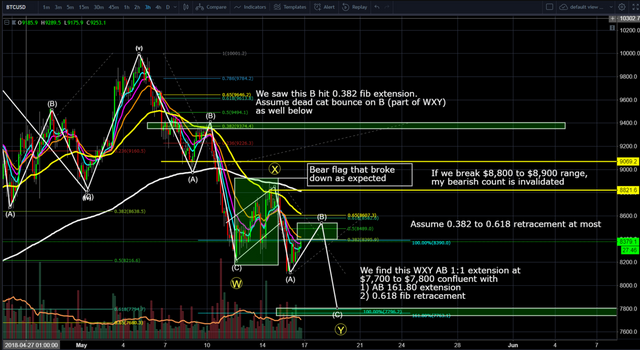
The bearflag pattern was dissolved like in a textbook example. He expects us to go up from here. Now, the further price action will depend on whether we will see 3 waves up or 5 waves up next. If we see 3 waves up, the correction cannot be done yet.
Two scenarios: 3 Waves up (bearish)
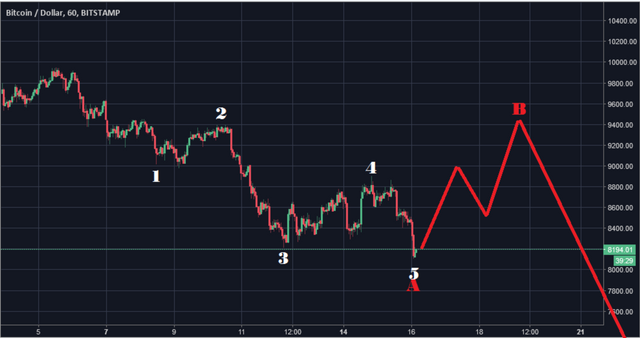
5 waves up (bullish)
@lordoftruth:
Bearish signs suggest price towards 7'650 - 7'770 area.
Bitcoin may pause from its drop as a double bottom formation can be seen on the 1-hour chart but from the technical point of view, the moving averages point to bearish risks in the short term, and oscillator is nearing overbought levels to reflect exhaustion.
He sees signs that market will likely continue dropping right to the next support area at 5/8 level at 7'770.
If bitcoin price fail to turn up at around 7'770 level - 6'519 low will be broken.
Todays trend is neutral. Trading between 7'770 and 9'050.
@philakonesteemit:
On the bearish side he sees retest of 8'650 to 8'750 range and than go down for 7'700 - 7'800.
On the bullish side, a break above 9'900 can signal a rally to 11'500, 11'750 range. Wave (3).
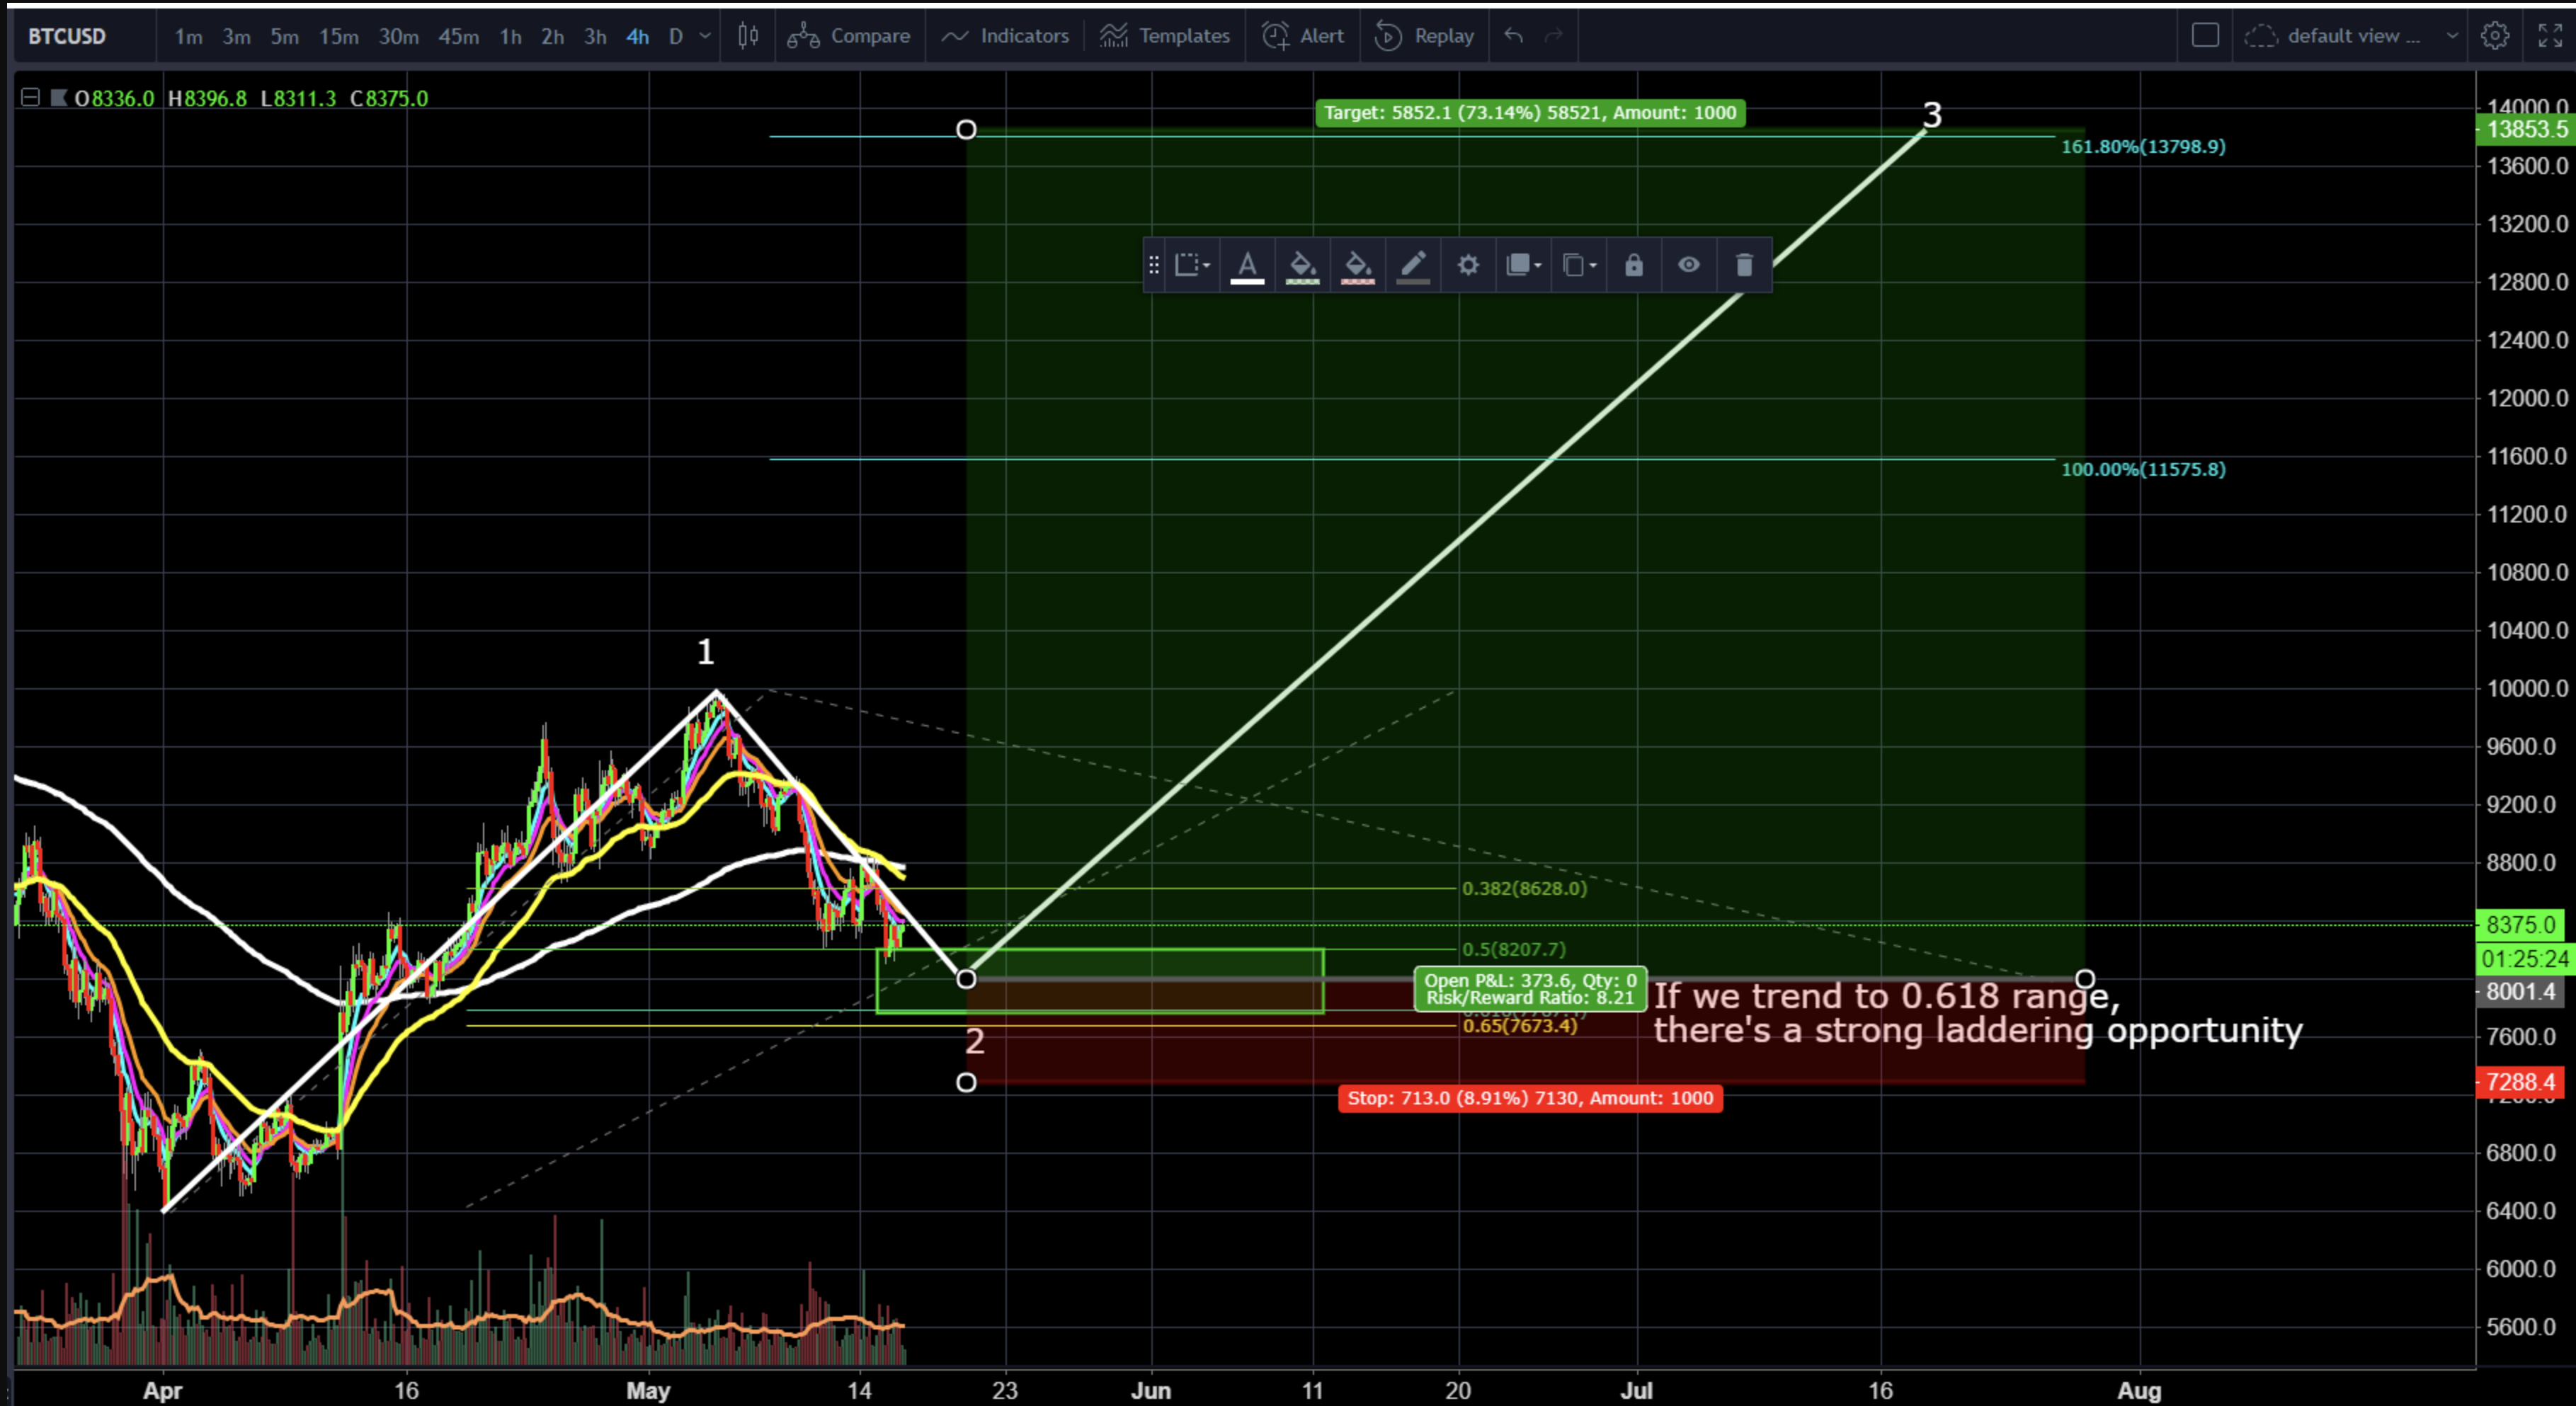
So it depends if we get rejected by 8'650 - 8'750 or if we directly go up.
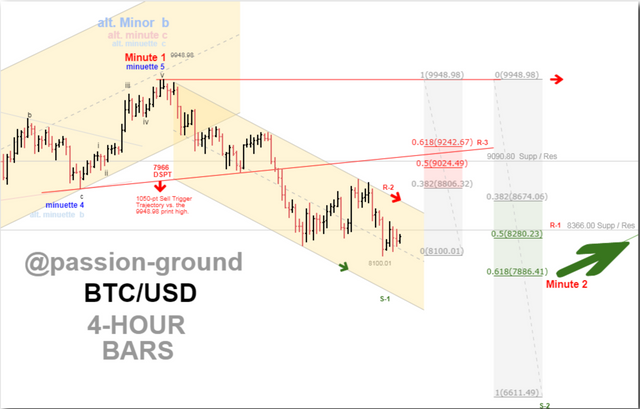
@passion-ground:
Although (basis the 4-hour chart) a bearish 5-wave impulsive decline off the recent 9'848 print high has manifested.From the current pullback low of 8'100, the 9'243 level (a .618 retracement thereof) becomes critical to observe.
If BTC is able to bullishly rally and “sustain” trade above 9'243 from here, it would then become highly likely that 8'100 would mark an interim low, and that we are on our way to riding a bullish 3rd wave up at the minute degree of trend.
If we get rejected instead would increase the likely hood of reaching the noted downside target of 7,966, or possibly lower before we mark the preferred bullish minute 2-wave down.
Summary of targets/support/resistance
Reference table
| analyst | latest content date | link to content for details |
|---|---|---|
| Tone Vays | 15. May | here |
| @haejin | 16. May | here |
| @ew-and-patterns | 16. May | here |
| @lordoftruth | 17. May | here |
| @philakonesteemit | 17. May | here |
| @passion-ground | 17. May | here |
Definition
- light blue highlighted = all content that changed since last update.
- sentiment = how in general the analysts see the current situation (bearish = lower prices more likely / bullish = higher prices more likely)
- target = the next (short term) price target an analysts mentions. This might be next day or in a few days. It might be that an analyst is bullish but sees a short term pull-back so giving nevertheless a lower (short term) target.
- support/res(istance) = Most significant support or resistances mentioned by the analysts. If those are breached a significant move to the upside or downside is expected.
- bottom = -> now renamed and moved to long term table. Low 2018
- low/top 2018 = what is the low or the top expected for 2018?
Further links for educational purposes:
- From @ToneVays: Learning trading
- From @philakonecrypto: Like in every post you find links to his amazing educational videos. For example here
- From @lordoftruth: Fibonacci Retracement
- From @haejin: Elliott Wave Counting Tutorial
*If you like me to add other analysts or add information please let me know in the comments.
I think you should be looking to join https://niffler.co to teach others how to trade.
Good post
Very good information excellent graphics friend thank you
Hopefully it all keeps rising! been a bit of a roller coaster lately
great post really like it.