The RAC experiment - The end of the downtrend
Purpose of the experiment
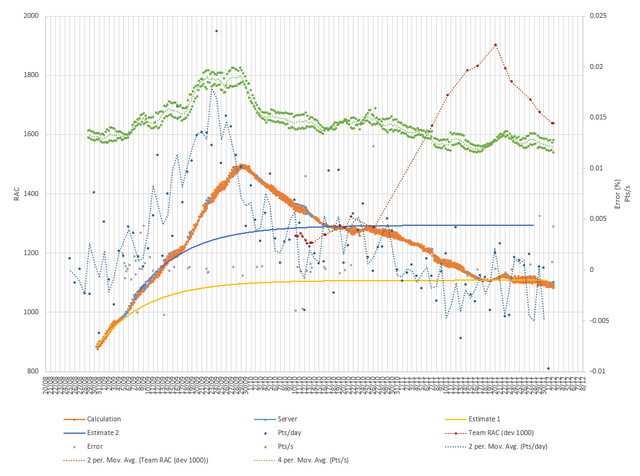
I continue this experiment because it provides interesting facts. The ones who are very involved in gridcoin know that RAC can change and is not predictable for various reasons. This experiment shows this with real life data and can help newcomers by example.
RAC is the result of some math I explained here. Some say this experiment shows nothing because there are plans to change the gridcoin source to work with a point delta instead of RAC. But even if this change happens we can draw conclusion because I provide the raw point accumulation as well.
Evolution
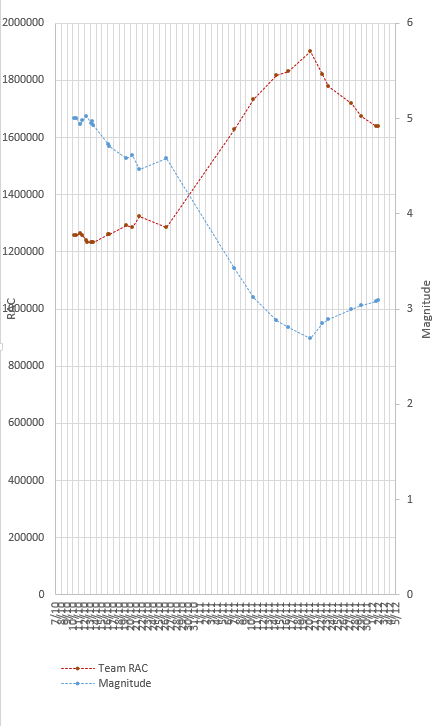
How did the experiment evolve since last time? Team RAC has continued to fall. Last time I was thinking there would have been a relation between team RAC and this host's RAC but I'm not so sure of that anymore. There seems to be some relation but not to the extend I was hoping for. The end of the team RAC rise seems to correlate with the end of my own RAC's drop. I was expecting my own RAC to rise again but for now that is still unclear. I'll continue data gathering in the hope to get more insights.


This post has most info about the first chart: The RAC experiment progress and request for help
This post has the motivation for the second chart: The RAC experiment continues
Posted on Utopian.io - Rewarding Open Source Contributors
Thank you for the contribution. It has been approved.
You can contact us on Discord.
[utopian-moderator]
Hey @jefpatat I am @utopian-io. I have just upvoted you!
Achievements
Community-Driven Witness!
I am the first and only Steem Community-Driven Witness. Participate on Discord. Lets GROW TOGETHER!
Up-vote this comment to grow my power and help Open Source contributions like this one. Want to chat? Join me on Discord https://discord.gg/Pc8HG9x