Gridcoin mining experiment - data gathering details
Every couple of days, depending on my own mood and enthusiasm more or less frequent, I go through the process of copying the data from the VGTU server to my own excel sheets to then produce the charts I post from time to time. Because I get questions about this process from time to time I decided to explain this process in this blog post for future reference.
Copy the task details
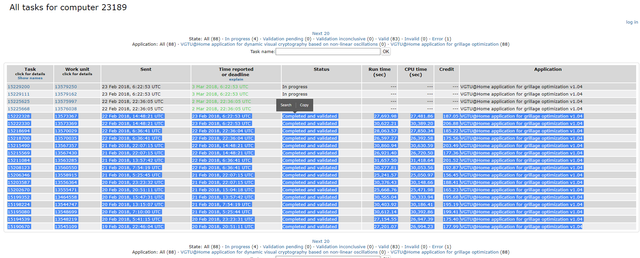
The first step is to check the timestamp of the last task available in the spreadsheet and copy all new task details of finished tasks from the website. Depending on how long it has been this can span multiple pages because only a limited amount of tasks is shown on a page. This is the case in below screenshot.
Format and verify
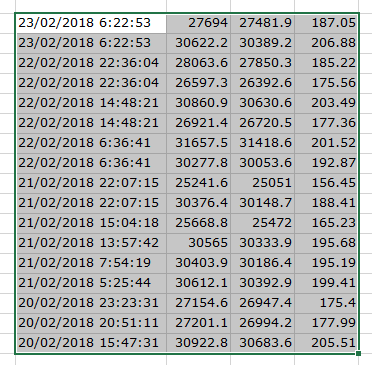
Next I verify the data to be sure it is valid for the experiment. The status needs to be 'completed and validated' and the application must not change. I then remove unneeded data and reformat the needed data to the correct format.
Insert the data
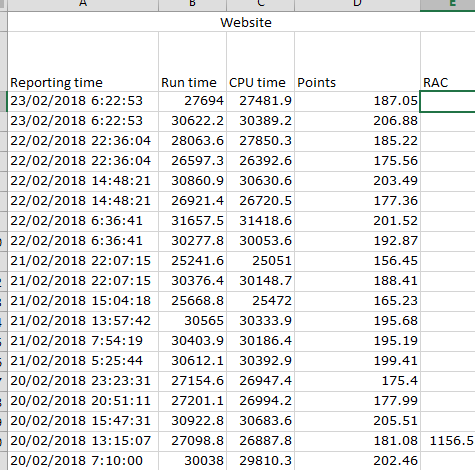
Once I have the data formatted I make room for the new data and insert it at the correct location.
Copy some other data
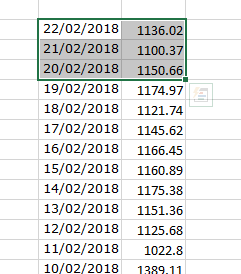
I need to copy the RAC from here, the team RAC fromhere, the GRC price from here

Verifications
Once I have all the input for the first chart I verify the data.
*From time to time the number of whitelisted projects changes so I verify if the calculated magnitude matches.
*Sometimes the data on the project server is not chronological. This is because the samples are shown in the order they were sent to the host which doesn't necessarily match the order in which they finish. For RAC calculation however they must be placed chronologically in order of completion. If that happens I need to switch some rows.
*If everything is correct the error should be very small.

Points per day
Once the data is verified I use it to complete the daily series.
Update charts
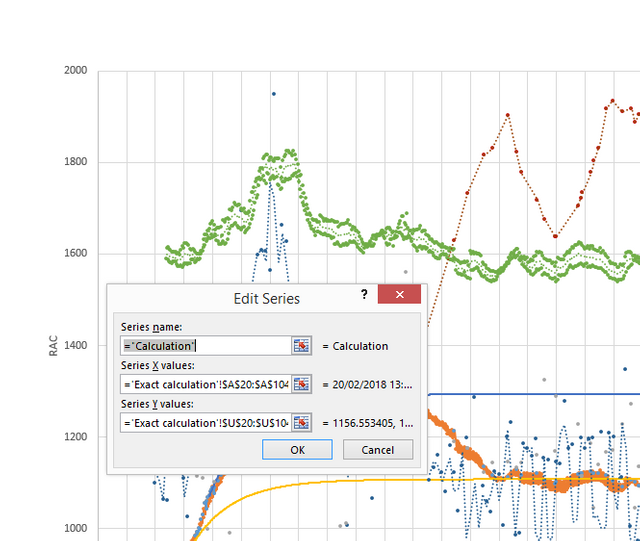
Now all data is available for the first two charts. The last step is to update the range for the charts:
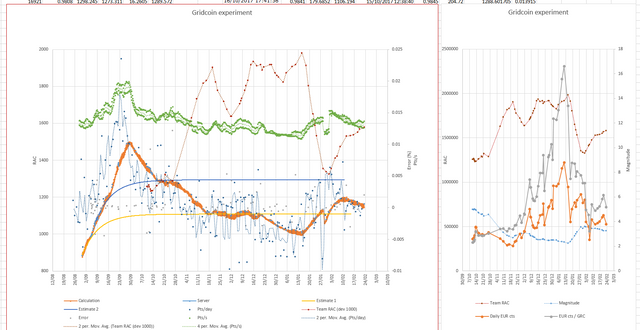
The end result is two updated charts:
Top 10 users
Then it's time to move over to the second sheet of the top 10 users. Before:

For these charts I gather the data from here. I select only the users that are in team gridcoin. Sometime new users enter the top 10 or the positions inside the top 10 switch. In such a case I move the columns around for my convenience. After:

Update the top 10 chart
For these charts as well the data range of the chart needs to be adapted.
Result
The result is twofold. A lot of data is available to try new formulas on. And some charts out of which we have been able to learn quite a few things.
Posted on Utopian.io - Rewarding Open Source Contributors

Being A SteemStem Member
This seems to be very uncomfortable process with all the copying.
Have you tried using @nexusprime's script to fetch the data? you would only have to check the dates, or maybe you could write a few lines to automatically fetch data up to the point you already have.
Also I am working on a little tool right now, as you can see here to analyze Credit/Runtime.
I would love to extend this and maybe at some point have a powerful tool to check out all your BOINC and Gridcoin statistics.
Extending my script to all projects for a given user is a cool idea.
Check out this website: https://boinc.berkeley.edu/trac/wiki/WebRpc#show_user
It should help you collect information about your hosts on a given boinc project. You can then feed the host ids from the xml file into my script.
It is. I have had the intention to change on it, to automate it but never really came to doing it. It would involve scraping the html as in the script I suppose, but from several pages, putting it all in a database, adding extra logic to verify and fix the exceptions, ... In the end it is just easier to do it like this.
If your up to the task I would gladly cooperate and help with it. There were a couple of guys in the past that had similar intentions but nothing got realized.
I'm a developer, I work on drivers in C++ and desktop apps in C#, but I'm a Windows guys ;-)
Feel free to contact me on slack maybe I could help or answer questions.
gridcoin is a MN coin? I have receintly been looking at data taken directly from mn blockchains. Maybe gridcoin should be on my list
What is MN?
Do you mean masternode coin? If so, the answer is no.
yes I did mean masternode...thanks for the clarification
Your contribution cannot be approved because it does not follow the Utopian Rules.
Suggestions:
You can contact us on Discord.
[utopian-moderator]
This post was made partially on request of utopian moderators. Check my blog for the many posts about this mining experiment. It is made up exactly for the purpose of clarification, promotion and development of gridcoin. All other posts go in analysis because they contain the data. This one goes into the details how the others are made.