Monitoring services with Ckeck_MK (Step By Step tutorial with pictures)
One of the issues that administrators are always concerned about is "how are my servers doing right now?”, in other words monitoring servers and services is one of the most important tasks when you are dealing with lots of servers. Because if you don't detect the problems at right time, they might lead you through a disaster which will cost you and your company a fortune.
How to think ahead?
The best you can do is to monitor all of your services and servers with different monitoring software, scripts, etc...
The solution is no-brainer, but what monitoring software to choose is important, everyone talks about his/her favorite monitoring software that they are comfortable with, and they claim that solution is the number one. I am not one of those guys, I just simply say this powerful tool that I am using works for me!
The way I do it!
Check_MK(OMD) is a very powerful tool considering these features:
- It is open source
- It is free
- The core is nagios and it is using Check_mk plugin
- It runs on all types of Linux distributions (it is a privilege for me)
- Works with all types of platforms and OSes
- Supports SNMP
- Have its own agent which uses a little resource
- mrpe(to monitor the output of your own scripts)
- Different sites on one OMD server (you can separate different type of servers, departments, projects, etc.. and dedicate them to specific users)
- easy to install
- ... and lots of other features
Installing OMD
First you need to install Epel repository (it is needed for required packages)
rpm -Uvh https://dl.fedoraproject.org/pub/epel/6/i386/epel-release-6-8.noarch.rpm

Now you need download the compatible package from here(I am using OMD version 1.30 for CentOS), and move the package to your OS(Let's say I put it in /tmp)
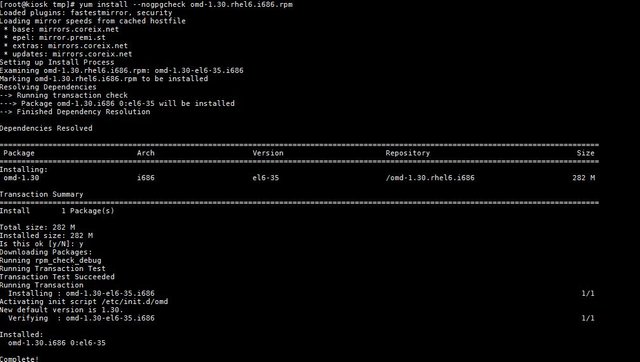
To install open Monitoring Distribution (OMD) on CentOS, simply run the following command:
yum install --nogpgcheck omd-1.30.rhel6.i686.rpm
The check_MK company is offering a new version of check_mk with OMD included, you can download that from here, it is a package previous one
Example:
yum install check-mk-raw-1.2.8p15-el6-38.i386.rpm
Note that you need to change the name to whatever version you want to download
At this point installation is over and you have an OMD monitoring Server but there is no site running on that server.
omd create steemit_projects
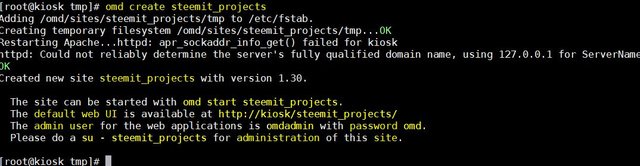
You can see list of commands and info that you need to start and manage your site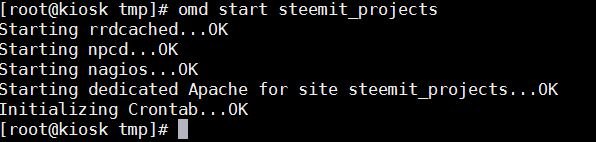
Remember that you need to set rules in your firewall to access the web from outside, and also put selinux in disabled or permissive mode)
iptables -A INPUT -p tcp -m state --state NEW -m tcp --dport 80 -j ACCEPT
echo 0 > /selinux/enforce
You need to change selinux configuration to keep the setting after reboot
vi /etc/selinux/config
In this file change the configuration like this: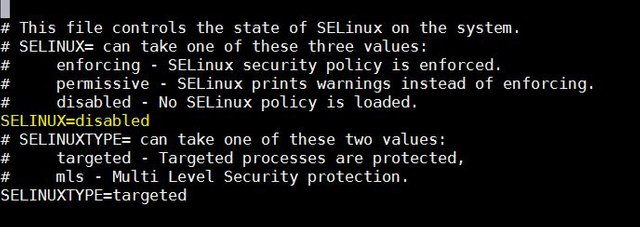
After setting the firewall and selinux, open a browser and insert your IP address and your site name like this: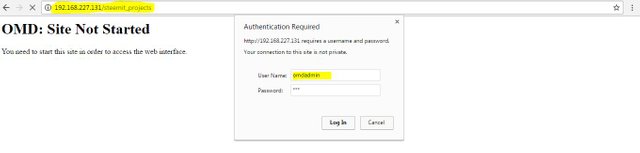
Default user: omdadmin
Default password: omd
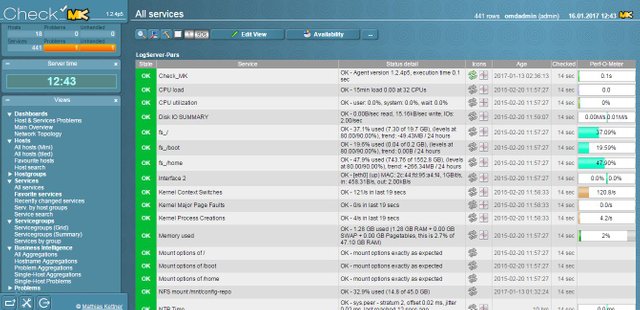
You can interact with OMD with different UIs like icinga, nagios classic, navgis, thruk, etc... Choose check_mk multisite for now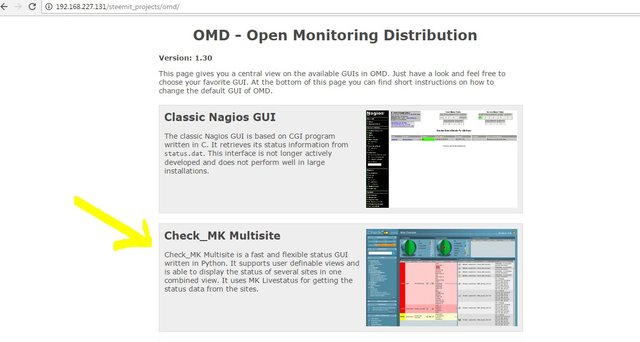
Adding a host(Host side)
I am going to add a Linux server to my Check_MK site, to do that you need the Check_mk agent where you can download from here
if you install check_mk raw version from here, you can access the agents from web server itself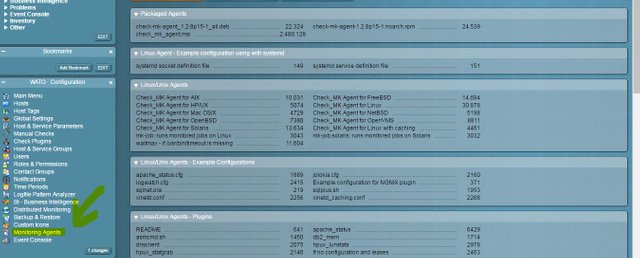
After downloading and moving proper check_mk agent to the host that you want to add to monitoring server(let's say /tmp/), execute following command to install the package:
yum install package name
example:
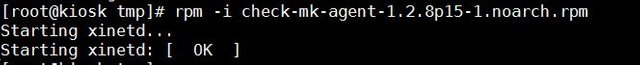
rpm -i check-mk-agent-1.2.8p15-1.noarch.rpm
if everything goes well, you can telnet port 6556 on your host, to add the host to monitoring you should open port 6556 on firewall and also set your server addres on xinetd config file
iptables -A INPUT -p tcp -m state --state NEW -m tcp --dport 6556 -j ACCEPT
vi /etc/xinetd.d/check_mk
remove "#" from this "only_from" and add your server IP at the end of line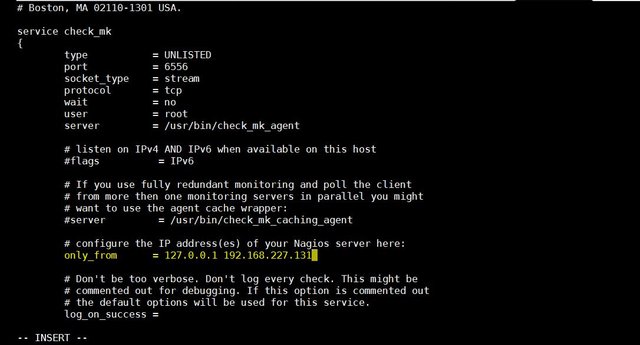
finally you need to reload xinetd service
service xinetd reload
Adding a host(Server side)
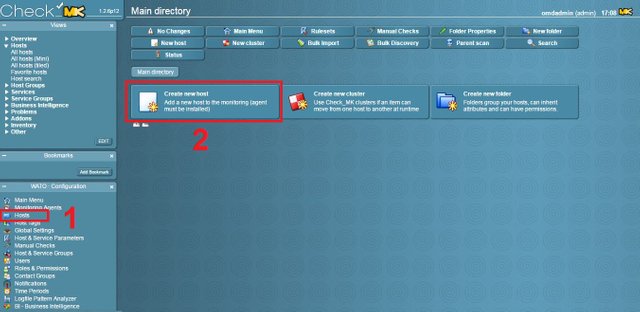
now set IP, host Name, permissions, etc... and finally click "save and go to services" then active missing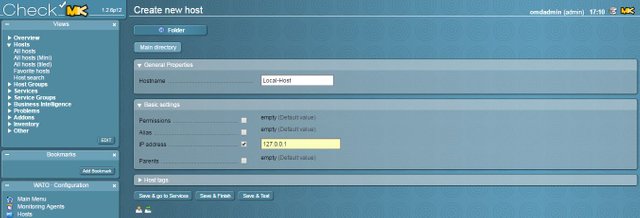
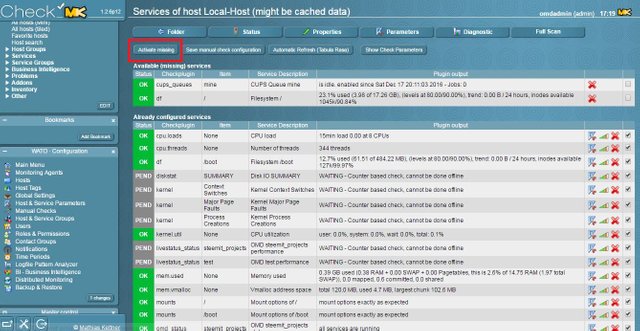
if you have access to the server and agent is properly installed on host, you can see the list of different elements such H.D.D, RAm,CPU, etc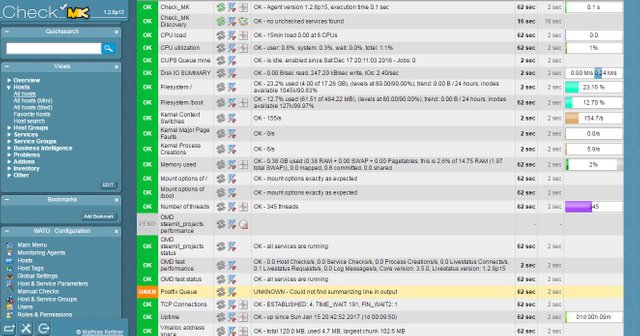
This is just the start, you can literally monitor anything you want on your servers, like processes , ports, IPs, performance, scripts, etc.. you just name it and Check_mk has something for it.
If you have any question please contact me disscordadd(same account) or my telegram account at https://t.me/rezaeimeysam
Thanks for reading my post, your feedback means a lot to me :)
this post is 100% powered up


Mon Jan 16 17:50:30 IRST 2017
Hello @meysam,
Congratulations! Your post has been chosen by the communities of SteemTrail as one of our top picks today.
Also, as a selection for being a top pick today, you have been awarded a TRAIL token for your participation on our innovative platform...STEEM.
Please visit SteemTrail to get instructions on how to claim your TRAIL token today.
If you wish to learn more about receiving additional TRAIL tokens and SteemTrail, stop by and chat with us.
Happy TRAIL!

thanks again for your support
This post has been ranked within the top 10 most undervalued posts in the second half of Jan 16. We estimate that this post is undervalued by $23.01 as compared to a scenario in which every voter had an equal say.
See the full rankings and details in The Daily Tribune: Jan 16 - Part II. You can also read about some of our methodology, data analysis and technical details in our initial post.
If you are the author and would prefer not to receive these comments, simply reply "Stop" to this comment.
I think you should do something about it then :)