CHART ART: USD/JPY Double Top Pattern

GOOD MORNING STEEMIT!
There is so much more to financial blogging than just posting charts. Reading chart after chart that you don't have an emotional stake in can be so tedious and downright boring if that's all that you're seeing.
It's for this reason that I have wanted to break up my CHART ART blogs with a short sharp Mindset series. But with so much of trading reliant on real world events, I want to start to add the odd News blog.
The plan for News blogs would be to centre discussion around the topic of the day, provide my two cents on the issue and hopefully open up the comments for you to rebuke and debate my opinion.
Keep an eye out for any News posts on the blog and be sure to get involved in the comments when you do see them flash past in your feed.
Anyway, onto today's CHART ART!
Chart Art
So my EUR/USD long bites the dust. But as I said on Twitter:
Where one door closes, another one opens.
There's always another trade.
It's so easy to get caught up in the emotion of a single trade. To get attached to whatever the position that you've taken is.
Always remember that our role as traders is to never be tied down to an opinion. The opinion helps you make the decision as to why you entered the market, but it should never keep you in a trade when the market tells you that you're wrong.
There's ALWAYS another trade.
USD/JPY
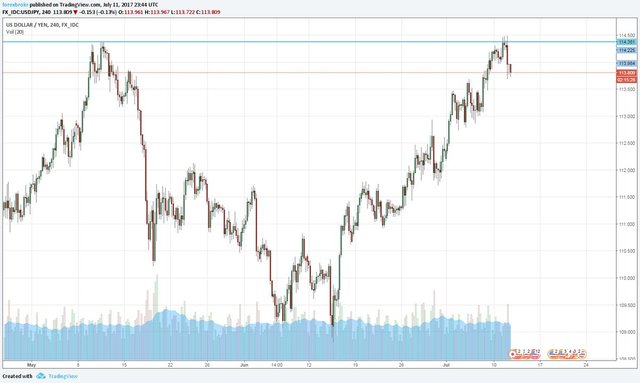
In this case, it comes in the form of the negatively correlated USD/JPY. With EUR/USD resistance breaking out, we’ve seen USD/JPY’s own resistance level hold, and markets move back into correctly correlated sync with one another.
Take a look at the charts below:
4 Hourly:

The 4 hourly clearly shows a double top forming and price subsequently being rejected from the second touch of the level.
This is our higher time frame level.
Now taking a step down into the intraday charts:
15 Minute:

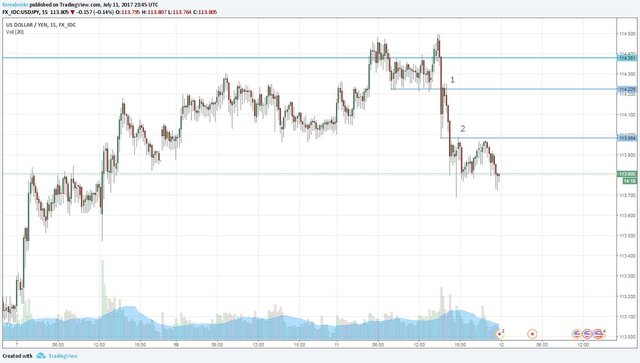
You can see that price is putting in the familiar stepping down pattern that we like to see.
This is where we can look to take shorts on short term rallies into previous short term support turned resistance.
My plan is to keep drawing lines on the swing lows and selling retests.
Let's do this!
Active @forexbrokr CHART ART Blogs
Instagram: @forexbrokr
Website: www.forexbrokr.com
Another step:
Congratulations @forexbrokr! You have completed some achievement on Steemit and have been rewarded with new badge(s) :
Click on any badge to view your own Board of Honor on SteemitBoard.
For more information about SteemitBoard, click here
If you no longer want to receive notifications, reply to this comment with the word
STOPYeah man, I like Your style, You are trading levels. Interesting to see how price crashes through supports like a meteor crashing through a building's floors.
I closed my EURUSD long at 1.14670, also because I was somehow angry on the swap ;-) , having bought at 1.13970. But I think that it still could reach 1.15ish area, looking on the daily chart. Furthermore I think, though frequently doing it, that closing positions in Aussie/Asia session often can be the wrong decision, because the market is really slow and we simply have to wait for London. Anyways: keep blogging!
Hey bongo,
I did the whole indicator thing in a past life and it's really not for me. Indicators are just a reflection of what happened to price in the past. If you can read price action in the present, then you have a head start. The way that price reacts around support/resistance zone tells you everything you need to know.
Screw Euro... I don't want to talk about Euro anymore haha. But nice trade even with the early close and there's probably still more in it if you want to get back in somewhere. Since you've already entered lower, you can almost treat it as the same trade and just play with your risk that way.
Thank you, and you too!
I like that you keep it simple with the technical trading, following patterns and such. Clean nice charts, like to see that. Do you ever consider the Elliot Wave theory in your chart analysis when trading technical?
Used that a bit to get a good entry (i trade mostly fundamentally though) and it worked pretty good actually.
Nice post. Peace dude :)
Hey Viking,
Naa, Elliot Wave isn't something I've looked into enough. I find that it's very subjective and the simple method of 'seeing how price reacts to horizontal support/resistance levels' is much more clear cut to me so I use that.
EW is something I want to learn more about in the future though. It's on my ever expanding to-do list anyway haha.
Always good to keep it simple and what works best for you :) I wish you all the luck in building your wealth friend!
Another, another step:
Another, another, ANOTHER step:
Capital takes refuge in JPY? Was my first quick idea.