Nature Biology Art - Fibonacci is Everywhere - Also in TRADING!
Since I started trading only a month or two ago, I'm fascinated by the enormous volatility of the crypto coins (sometimes even more than 100%). Even the coins with a large market cap like Bitcoin can move relatively large percentages in a single day.
Cryptospace: Large Markets Caps are Tiny Market Caps
Although main stream media is bringing more and more news from the cryptospace to the world and innovator investors and traders from outside cryptospace are entering the markets, cryptospace markets are still tiny compared to US$, Euro or even corporate market caps.
Bitcoin (BTC) has a bit more than 30 Billion US$ market cap with around 45% of the total market cap of all 700+ altcoins. This sounds a lot, but in terms of the 'normal' financial world, this figure is peanuts; WhatsApp was purchased for a bit more than 20 Billion US$ by Facebook some time ago and the market cap of Apple is around 800 Billion US$; the central bank of Europe is pumping around 90 Billion US$ into the Euro-zone economies, every month for already more than year and will continue to do so for coming months, maybe even longer.
But so much about that - Back to trading.
Technical Analyses: Hoax or Real?
Many traders and investors in stocks, bonds, currencies and other financial and tradable products are using technical analyses methods to determine what the best entries (buy) and exits (sell) are. Although I have a very analytical mind, love mathematics, and I know traders are using electronic systems with technical analyses build in (and may even use auto trading systems); When I started trading in cryptospace my first thought was "How can technical analyses be applicable for cryptospace? So many pump and dumps! So small markets; Too small to apply statistics and other mathematical theories to determine entries and exits!".
I wanted to know more!
This weekend I started to read up on technical analyses, and discovered something already really interesting. One of the methods to determine entries and exit is using Fibonacci Retracement Levels. These are specific mathematical calculated levels using always the same formula to derive values at which a tradable asset may reverse in a trend, eg an asset with a downward trend may reverse its trend when getting to one of the Fibonacci calculated values.
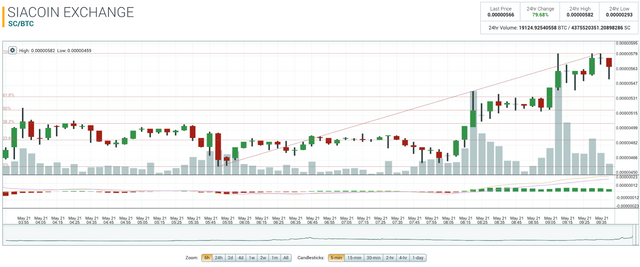
I applied the Fibonacci retracement levels on a coin I'm trading in for the last couple of days, Siacoin (SC). The chart below is the 5 min candlestick chart for the last 6 hours. The horizontal lines across the chart with the percentage values at the left 100%/61,8%/50% etc are the Fibonacci retracement levels. As you can see in this chart Siacoin stayed quite nicely at and between the various lines.
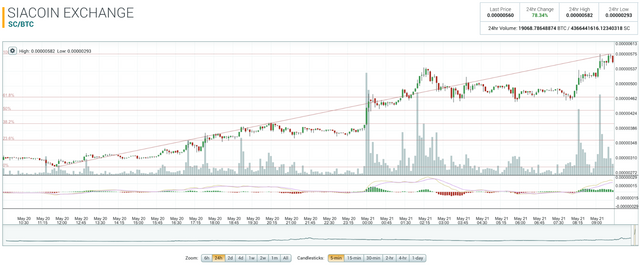
Zooming out on the same chart to the last 24 hours shows similarities. Although the graph of Saicoin is a little less at the lines itself, still you can see the graph more or less following the Fibonacci retracement levels.
This is most curious, isn't it? I'm fascinated, for sure! You?
Fibonacci Retracement Levels: Explained in Layman's Terms
Fibonacci (real name: Leonardo Pisano Bogollo) was an Italian mathematician and lived in the middle ages, around 1.200 AC. He created a sequence of number based on a formula, called the Fibonacci series. The logic of the series is quite simple: it start with zero and each following number is the sum of the two numbers before it.
The series start with o. The following number is 1, since there are no former two number, simply the next number in our decimal system is taken which is 1. The following number after that is the sum of the previous 2 numbers which are 1 and 0 which equals again 1. The next number is than the sum of 1 and 1 equals 2. The following after that is the sum of 2 and 1 equals 3. Followed by the sum of 3 and 2 equals 5, and so on... The sequence looks like this:
0, 1, 1, 2, 3, 5, 8, 13, 21, 34, 55, 89, 144, 233, 377, 610...
The Fibonacci retracement levels are derived from this series using the method of dividing a number in the series by its next higher neighbour number, by its second neighbour number, by its third neighbour number. The results of these calculations becomes the Fibonacci Retracement Percentages/Levels.
Interestingly the percentages are approximately the same regardless what number is used to start with, whether this be 8, 55 or 233 or any other number in the series (note: the earlier numbers in the series are out of scope; they have some 'startup' issues so to speak).
For instance we take number 55 to calculate the percentages:
- 55 divided by 89 = 0,618 = 61,8%
- 55 divided by 144 = 0,382 = 38,2%
- 55 divided by 233 = 0,236 = 23,6%
If we would have taken 144, we would have the same results; Just try it! The first percentage is 144 divided by 233; The second percentage is 144 divided by 377 and the third percentage is 144 divided by 610. You see? Same result! If you don't believe it, try yet another number; You may even want to extend the series first and try higher value numbers. I assure you, you will find always the same percentages (well approximately, not exactly exactly the same). These characteristics and feature makes the Fibonacci series so interesting.
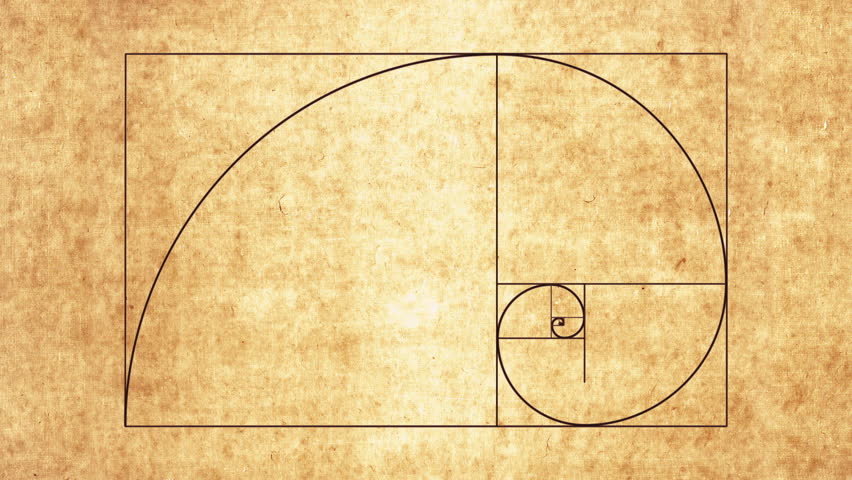
It becomes even more interesting when at some later date in our history it was discovered that the first ratio (0,618) is equal to the Golden Ratio.
Note: since we calculated percentages, we need to have some number to take a percentage of. In trading charts the Fibonacci range is determined by the highest value on the chart and the lowest value on the chart. Usually you see a line between these two points and we can call this line a diagonal.

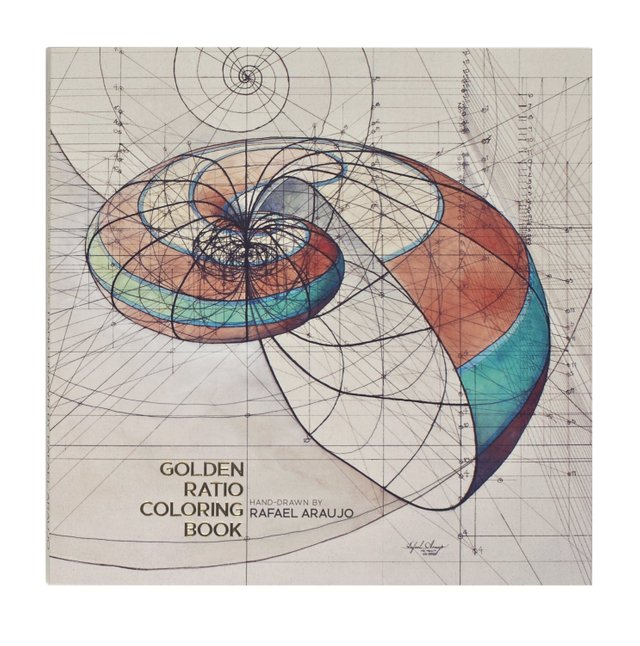
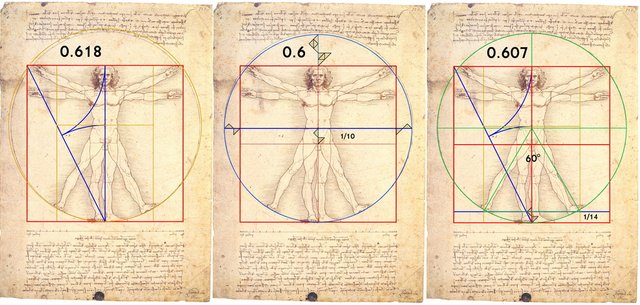
The Golden Ratio
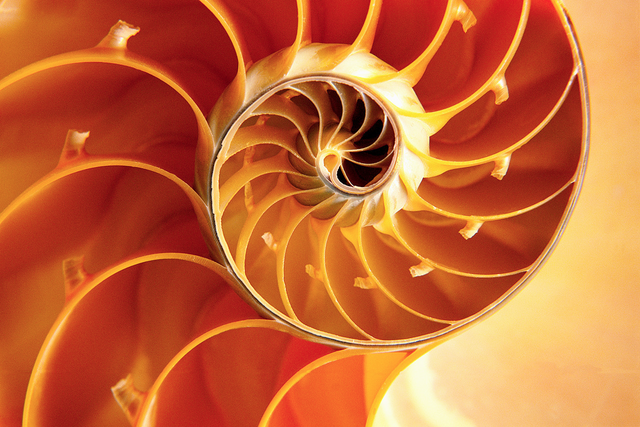
You may have heard of the Golden Ratio. The ratio we frequently see in nature, biology and also architecture and fine art (the later are human made so these can be manipulated; but nature, biology and the human itself not). The golden ratio has been observed in the Parthenon, Leonardo da Vinci's Mona Lisa, sunflowers, rose petals, mollusk shells, tree branches, human faces, ancient Greek vases, and even the spiral galaxies of outer space.
The golden ratio is the division of a number in the Fibonacci series by the next higher number (the number directly to the right in the series) which results in a number that is approximately 1,618 times greater than the preceding number regardless what the base number is used.
This figure 1.618 is called Phi or the Golden Ratio. The inverse of 1.618 is .618.
Conclusions & What's Next
Although Fibonnaci retracement levels is just one of the so many method used by traders to determine their tactics, I'm intrigued and for sure want to know more of technical analyses.
I'll for sure spend time on this, and at the same time I hope you can guide me in where to start, what to read and how to learn applying technical analyses and determine and conclude good trading decisions.
Disclaimer
None of the information given in this post is to be regarded as an advise to you. It is meant for informative purposes only. By no means I pretend to be a specialist, and by no means I give you advise to followup on whatever I have written in this post.
--- media sources [1][2][3][4]
--- follow me @edje
A lesson on Fibonacci and the Golden Ratio alone is worth an upvote and resteem 😊
so true . I didn't know much about it
Thank YOU! :)
Very good, resteemed.
Thank YOU!
You have refreshed my mathematic knowledges:-) Interesting idea, I didn't know that it can be used in trading.
Are you trading?
When so, turn the Fibonacci setting on and get a feel for what the traded assets do. I have it turned on since today and try to learn from it, to see if it is true what the traders who uses technical analyses for their decisions claim! :)
A little bit.
I'm doing my first steps, accumulate knowledges and try to use them in real life. Some kind of experimens:-)
Thank for the tip, I will check how it works.
I'm also learning trading. Use funds I earned here at Steemit. Because of that I see that I take risks! Sometimes they are very rewarding though. But I like to figure out if I find trading interesting enough as well as if I can find a kind-of- de-risk way of trading so that I can make my profession of it. Not sure I like it that much though :)
Enjoy learning!
Great post!
I like!
Thank you! :)
Thank you for posting @edje.
Lovely post and photographs and graphs. Appreciate your thoroughness.
This is an idea that sounds worth giving a go.
Kind Regards, @bleujay
Thank you again for swinging by my posts. I try my best to create interesting posts that explains things in a simple way. Keep in mind, technical analyses for traders have multiple instruments; Just the Fibonacci will not do the trick. I'm still learning to apply Fibonacci, and need to figure out the other instruments. Hopefully will know a lot more in a month or two.
wow , what an amazing insight and detailed information. You are so cutting edge @edje :)
Thank you so much for your super kind words!
Hope you can use it yourself when learning about trading?
I am stunned and yes I suck it all in and hope my brain can take it 😜
Just bookmark it for easy reference. In Poloniex (and probably all other exchanges as well, it is a setting and the Fibonacci levels are drawn in the graph by default. I have these lines now switched on by default and just analysing them while I trade. I do not plan to make my decisions based on these lines yet, ie continue with what I was doing before; Gut feel trading :)
thanks. this is great. never try Fibonacci retracement on my trading maybe someday, ill have to read other books. thanks for this great info.
I'm not apply any technical analyses on my trading. Mostly its is gut feel :) Or maybe it is gambling what I do; Not sure yet hahahaha
But I want to learn about the technical analyses and find out if that can bring me better longer term results in trading. So far, I was either lucky or just my method of trading works; Short term wave up riding, trade in/out minutes, buy more when going down and wait till at least break even; I think this method can be quite risky on the other hand I usually don't wait fort he tops and bottoms; Bring me usually interesting positive percentages; Risky bit is to go all-in in 3 to 4 purchases so when then still I cannot get to breakeven on a coin that went to wrong way, I may loose big time. So far, it did rarely happen, but then again, I may have done 50-70 trades in my life :)
just riding the trend i do that also.
With success I hope :) But I take the short short trend, look at the combination of outstanding orders, market depth, and contract sold and the speed thereof.
They are Ocean Currents, very unpredictable.....nice one mate , it's all part of living a Good Dream like my post said - WE ALL LIED, NOBODY IS LIVING THE DREAM
I do not agree to that; Nature and Biology tells us the Golden Ratio is real! If it is real for trading, that is the question. When many traders use the Fibonacci percentages to determine their best entry/exit points, then this can indeed become true, even if by nature is was not true at all. That is where I come from, ie Fibonacci is not real in trading, but made real because the majority of traders are using the Fibonacci based rules. But even then, when that is that case, and the Fibonacci based trading rules are made real, then it can be used to predict better the entries and exits. That is just pure logic applied to the phenomenon. But as mentioened in the article, I really need to learn much more of all of this to get confirmations that these type of rules can indeed make trading decision better.
interesting arguement - but the sequence is of natural origin, as are traders ultimately one might suppose, but I'd put the sequence 1st! ;)
Correct, but not unpredictable :)
I second you in the learning process, cos it all seems like prefabricated magic to me when i see the graphs.
Take it in small steps at the time. In the end technical analyses is relatively simple mathematics and rules, but can be overwhelming when not be a beta person. For me the mathematical side of things is not difficult, I just need to understand the rules... I use mini steps for that. When I have more to share I will.
Thank you very much for your interesting article.
However, I still don't really get how the Fibonacci numbers actually relate to every given (stock) graph. A mathematical necessity seems to be very unlikely. I think it's more like a self-fulfilling prophecy, right? That would mean that every participant in the market simply anticipates this behaviour according to the Fibonacci series and thus it becomes a reality.
That is what is not clear to me indeed. Could indeed be self-fulfilling prophecy, that is why I want to research this in practice, while not using it to change my trading method until I have figure this out. But even when it is self-fulfilling prophecy, it can be used to decide trading tactics. Keep in mind, the Fibonacci levels are different for each length of graph, ie for a 6 hours graph they look different than for a 24 hour graph, or 2 weeks graph. Every trader has there own way of deciding, based on what timeline in the graph. Also Fibonacci is just one of the instruments they us, other parameters and instrument they through in the mix as well. Therefore it'll be not be that easy to defend that Fibonacci is just a hoax. I'm a beta guy, so for me science is leading, but nature and biology shows the Golden Ratio being everywhere...That is curious, right?
That's actually very fascinating indeed. Please tell us about the results you get and whether this method really works. It would confuse me a lot if an artificial and chaotic system (such as the stock market) would actually follow any natural pattern at all.
It would confuse me even more if the stock market would behave according to the Fibonacci series on any given scale.
I have to do further research on this, but I've seen more historical patterns kind of following the fibonacci lines. My logical explanation is that many traders use this instrument therefore creating the support and resistance levels according to these instruments, more or less self fulfilling phrophesy.
Last day or two (with great support of some others who are good in trading), I'm adopting the break out strategy. So far 5 trades successfully with per trade 20%+ gain. Discovery of these breakout point did not include Fibonacci at all.
Do you have experience with breakout methods and how to discover them? I wrote an article on that, well I found a piece on Investopedia that I included in that article with the request of that is correct and I shall use to study that method further. I guess the 'thing' in breakout method is to discover the right coins at the right times and levels for go-in. That'll probably the most difficult part, although now with many coins going up, even when they go down at some point the breakout anyway. That makes trading easier, but may not be sustainable in the long run due to lower amount of breakouts, more stable coins and all.
But how can it possibly be a self-fulfilling prophecy if it works at any given time scale?
I'm sorry to tell you that I don't have any experience with any trading method. To be honest, day trading is simply speculation for me. The only real strategy making complete sense to me is the Warren Buffett method: Buy and hold forever. ;-)
I did, however, sometimes try to be smarter than the market by doing some day trading but so far I was always worse off afterwards...
I don't know. But there are not so many percentage lines, and when most traders look at 1 or 2 times scales to decide on, then you have a critical mass acting on more or less the same data. But that said; I don't even know if it is self-fulfilling prophesy.
I think you are wrong here. Daytrading can be done with whole set of indicators and realtime data. Realtime data such as open contracts buy/sell + market depth (distribution of open contracts), realtime contracts buy/sell and the speed / volume and number of buy vs sell at each given moment + candle stick charts can tell quite a lot about the coin and what is happening right at the moment you are looking at them. Will you believe me that in the first days of trading where I adopted the method of riding the constant little waves in upwards direction brought me more than 30+% gain (read here and here and here about it). Would you also believe me when last night and this early morning I got our of 3 break out trades with 20-30% each trade and overall (over enter trading budget) gain of nearly 8%? Since this morning I bought into 5-8 other coins on break out strategy; All are not broking out, I still have half of those in profit of at least 10% and still holding for real break out, and the other half is in some minus. But overall again I'm a little more than break even, ie overall a small profit. I did a couple of things that is not right, namely buying the coin before break-out; while one should buy they coin when is it broken out, ie stop limit order instead of buying order. That is the reason why I have some coins on minus. Only next days I'll know if I picked the right coins, I actually hope some of those coins will start moving when Asia wakes up again.
So, in my view daytrading is for sure not speculation. Well not more speculation than buying and holding forever. But nobody can see the future, not even Warren Buffet. So in everything you invest with some future in mind, is somehow speculation.
On break out strategies as so many other trading strategies I'm a complete newbie, so I hope I've done some analyses right for the coins I selected this morning, but only time will tell. Until this morning I was getting advise from someone who makes about 20% a week on break out trading with a fixed 20% gain set per buyin.
Interesting point of view. However, I still think that you have to look at the underlying value of the things you are trading (like stocks, cryptocoins, etc...). Just saying "get in at point X and out again at point Y" seems a bit too vague to me.
Wouldn't all those strategies simply stop working as soon as everyone is playing by their rules?
One point I don't want to argue about however is the fact that some people actually do earn money by doing day trading. I sincerely hope that your analysis enables you to make a lot of profit but I highly doubt that it's worth the time and efforts for the average Joe.
Sure, those who do not go into the details, will likely not make it.
I agree! It seems that cryptospace is kind a like all these promising startups in Silicon Valley with an interesting an idea and a story. In the long run I would like to think only those coins will survive that have some real services, revenues and assets connected. However, from a short term trading perspective, the 'content' of the coin becomes lesser relevant, I think :) Keep in mind, I'm a newbie in trading, and just apply my logical thinking here.
Thank you for sharing this great article :) Upvoted, Resteemed and Followed!
Thank you! Followed you as well, You make some interesting doodles :) quote different to what others would name 'doodles' :) I like :)