RE: POSSIBLE SLINGSHOT BITCOIN CRASH AHEAD
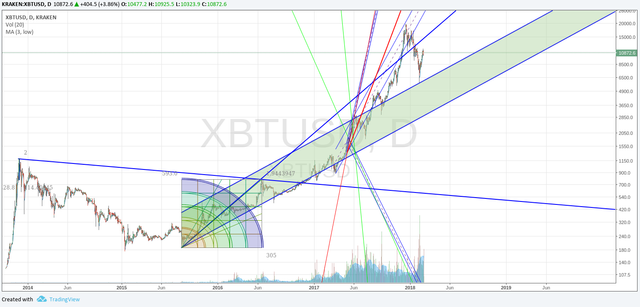
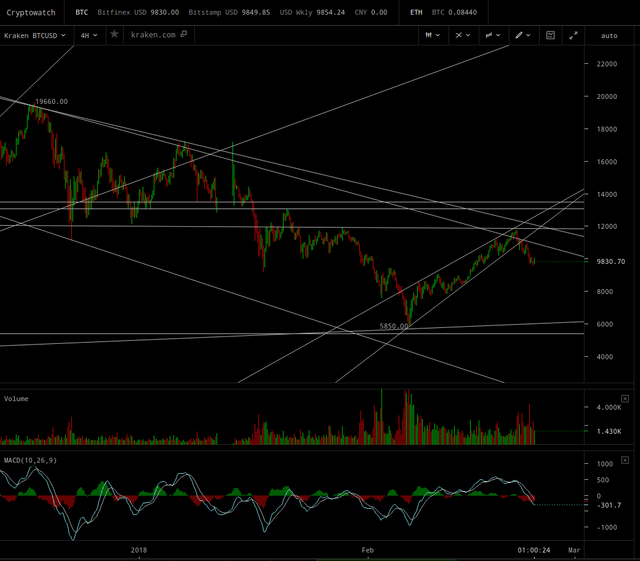
As indicated by the update to my prior post, I expected it to fall down out of the ascending wedge, and I was correct to expect a renewed risk-off due to release of FED minutes. We sold above $11k and looking for a significant decline into next month, perhaps as low as $5500. I had actually drawn that horizontal line on my chart well before the peak was reached at $11,7xx, and that turned out to be exact resistance line. I reiterate that Armstrong has explained numerous times that rising interest rates can correspond with a rising stock market, and he reiterated today that the real risk is the coming sovereign debt contagion due to rising cost of servicing debt with the end of ZIRP/NIRP and the contagion of bank failures expected.
https://www.armstrongeconomics.com/market-talk/market-talk-february-21-2018/
Early futures losses were quickly reeled back-in once the cash market opened and the DOW raced up around 150 points before levelling back around +75. As we await the FED minutes, the USD continues to climb with DXY now pushing higher towards with the 90 handle for a couple of days now. FED Minutes release saw a whip-saw reaction with the DOW rallying over 300 points. However, that was to be short lived and soon the DOW was back in negative territory and the close (-160 points) does not look constructive! Sentiment remains focused on the bond market and there yields are being hit on both wings of the curve. DXY looking to have confirmed its timing….
Japan 0.05%, US 2’s closed 2.27% (+5bp), US10’s 2.95% (+6bp), 30’s 3.23% (+8bp), Bunds 0.74% (u/c), France 1.01% (+1bp), Italy 2.04% (-2bp), Greece 4.32% (+3bp), Turkey 11.54% (-5bp), Portugal 1.97% (-5bp), Spain 1.50% (-2bp), Gilts 1.55% (-6bp). Remember that European yields closed before FED Minutes were released. We will need to see Thursdays open before we see the extent that spreads have moved. It will be interesting to see how the battle between the Central Banks plays out! Worth keeping a very close eye on High Yield funds, but especially ETF funds. Can’t imagine there is much new cash destined for that market!
EDIT next day: chart updates:

click to zoom

click to zoom
EDIT day after prior chart: when I posted those charts last night (night for me in Asia), it looked to me like a bounce was forming, and I thought maybe we should repurchase our 5 BTC (would have yielded > 5.5 BTC), but decided to sleep on it. Then I saw the DJIA closed Friday above 25300 which is bullish for next week. So we purchased 5.25 BTC at $10,300 to lock in our gains. Looks like we are headed back up to a double-top below $12k and then we’ll re-evaluate from there.
EDIT 2 days later:
yeah feels like it would've crashed already if it was to crash... interesting times
I am not ruling out that it won’t make another crash in mid-March from higher prices than currently, but what I see it appears to be curling up in a cup formation.
EDIT after sleeping: Okay so I’m expecting $11.5k by Wednesday. Then we have the new FED chairman giving testimony at Congress. So that will be too fast of a rise, and thus that might be the start of the next downwave. I have a resistance line there (as well as one right here at $10.4k which it is currently trying to hurdle). It’s also possible we hurdle through $11.5k then onwards to $13k. Mid-march is another turning point though on Armstrong’s model. So caution at $11.5k and again at $13k.
To zoom the two charts in the prior post, please click here instead. I was informed about a problem with
imgur.com.Here’s an updated chart showing that I had more or less predicted each top of the deadcat bounces in ascending bearish wedges. And showing where the price might end up ~$6400 in the week of March 12 if the combination of FED chair testimony and the Italian election spooks the markets into risk off:
click to zoom
That is not a prediction; just the range of possibilities I see as not very improbable. The very improbable is $3500 and shouldn’t go below that in any case.
EDIT: on further study with a wider perspective, there’s an inverted H&S pattern on the above chart, which is targeting $13+k, with a possible spike up to $15.7k. This may occur before any renewed decline. $15k was my first quip as to the price I would like to sell, when the price had first declined below my $7000 – $8500 target for a potential bottom.