RE: Most Important Bitcoin Chart Ever
This post is a continuation of the prior post which this post replies to, because otherwise the said prior post would have exceeded Steem’s annoying 16KB post size limit.
Tangentially, I forgot to mention in my prior post that Topological Data Analysis is essentially what I proposed as k-clustering in my 2016 blog Improving Steem’s rankings to cater to diverse content preferences, but which wasn’t an attempt to solve the insoluble economic, math, and game theory problem that Blog rewards CAN’T be widely distributed if minted from a collectivized token supply:

They ignored (or rejected?) my suggestion.
Moar Price Projections
Let’s consider only the ratio from each preceding ATH of the three separate wave patterns in the peaks which formed ATHs.
| Days | Price | Ratio Wave 1 | Ratio Wave 2 | Ratio Wave 3 | Ratio Rogue Wave |
|---|---|---|---|---|---|
| 493 | $0.0030 | 3.75 | |||
| 549 | $0.008 | 2.5 | |||
| 554 | $0.08 | 10 | |||
| 614 | $0.18 | 2.25 | |||
| 667 | ($0.35) | 4.5 | |||
| 763 | $1.10 | 3.1 | |||
| 881 | $19 | 17 | |||
| 1553 | ($165) | 8.7 | |||
| 1787 | ($972) | 5.9 | |||
| 3628 | $19,666 | 20 | |||
| 3785 – 4131? | $78,664? | 4? | |||
| 4131 – 4253? | $208,460? | 10.6? | |||
| 4253 – 5105? | $1,500,909? | 7.2? | |||
| 5561 – 7356? | $31,699,198? | 21? |
In addition to a possible “rogue wave” to $78,664, the above model predicts two new ATHs peaks of $208,460 and $1,500,909 before the halving in 2024. Mostly likely the $208,460 peak must occur in 2020 and the $1,500,909 could occur anytime between end of 2020 and end of 2022.
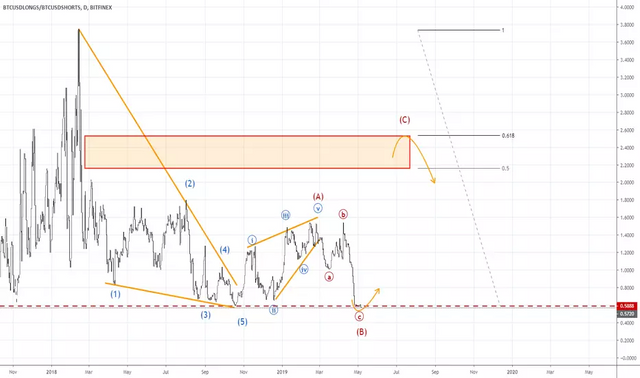
Following chart (originally created May 2017) has been prescient so far, but should be invalidated on the coming $208,460 and $1,500,909:
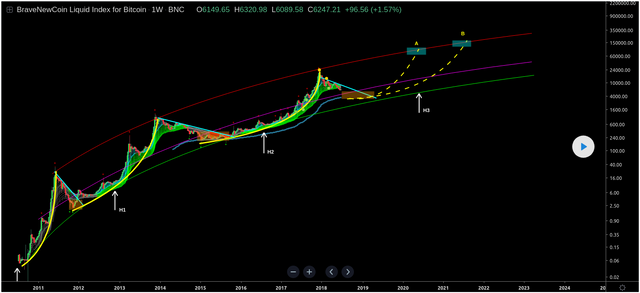
Bitcoin: A Long Tern Market Analysis
Timing
Note the (posited to be a “rogue wave”) vertical moonshot spike to $0.18 at 614 days rising from the low volume spike low $0.03 at 598 days then crashing to $0.01 [$0.06]‡ at 638 days. That would project a crash from any $78,664 down to ~$10k or below $3k! Essentially the pattern from the start of the chart is likely repeating again.
Said vertical moonshot (which would correspond) to any $78,664 should then be in roughly the center from the prior $19666 ATH to any $208,460. Thus if the $78,664 is happening now April through May, then $208,460 could be Q4 2020 and any $1,500,909 perhaps Q3 2021. If $78,664 was delayed later in 2019, then any $208,460 could be delayed to 2021 and and any $1,500,909 perhaps in 2023. However, that $1,500,909 terminates at the first (left-most) #3 so instead perhaps the timing of the three peaks ending in #5 will apply to all 3 said peaks (including rogue wave) being equally spaced in time since $19666.
Three other ways of projecting the possible timing for coming #5 peak:
Correlating the relative proportional length of peaks with coming #5 as a blue-circled peak predicts that the peak should be in the
last week of Apr 2019. Is the price going to$78664from $8k immediately?(1787 − 1553) × (3265 − 2197 + ) ÷ (1787 − 1043) = , = 490 days
(1787 − 1553) × (3265 − 2197) ÷ (1553 − 1043) = 490 + 3265 = 3755 days
3755 daysis Apr 22, 2019
Correlating the relative length of the bottoms for prior #3 to succeeding/current one, to the length of the #3 to #5 move, which predicts the peak should be in
Aug 2020. I could definitely envision$78664before the May 2020 halving if the price is headed to $208k or $1 million before end of August 2020.(1787 − 1553) × (3628 − 3265) ÷ (1639 − 1553) = 988 + 3265 = 4253 days
4253 daysis Sep 1, 2020
Correlating the relative proportional length of peaks with coming #5 as a large red-circled peak predicts that the peak should be in the range of the
last quarter of 2020up tofirst four months of 2021.(1787 − 1553) × (3265 − 1043) ÷ (1553 − 1043) = 1020 + 3265 = 4285 days
4285 daysis Oct 3, 2020(1787 − 1553) × (3265 − 598) ÷ (1553 − 1043) = 1224 + 3265 = 4489 days
4489 daysis Apr 25, 2021
Reasons to think this current rise in May won’t go all the way to $78k:
The long/short position had already rebalanced to
1.0at ~$8K price (but now has declined back to0.9), although both longs and shorts (and also exchanges that offer margin trading) could be wrecked by massive volatility.We’re not yet at the May 2020 halving which will provide the massive level of undervalue in the BTC price per the stocks-to-flow model, as mentioned in my prior post.
I believe there are small blue-circled peaks (smaller than the small red-circled peaks) in each #3 to #5 move, we just can’t normally notice them (although they are probably in the data) because they have been too small. But these may be growing in height along with #3, and may become more noticeably formed. We may be in the first of a pair of these now which would occur before any $78K. Actually I believe the peaks in a staircase pattern in late 2010 and 2011 are actually these blue-circled peaks for the prior fractal cycle which can’t be seen entirely because there was insufficient price data before July 2010.
So the pattern we are likely to see from now until end of 2020, is this staircase pattern.
So indeed given the three peaks model we could be headed to $78k now in May 2019, although I am still in a state-of-disbelief about this possibility and trying to find another possibility (was hoping such an initial move would start in Oct/Nov instead).
Note there is a possibility this currently move will top out below $15k, perhaps as low as $10k, then a decline into August, which might not alert the market that this cycle is going be very different from the prior two. It’s also quite possible that there will be no “rogue wave” and instead it will be merged as very high volatility into the move to $208k. IOW, what appears to be a rogue wave may have just been an increase in volatility that at such low liquidity in 2010 resulted in some fantastical spikes high and low.
‡ C.f. same section footnote in prior post.
Gold as an alternative to fiat to take profits into
A move to $1 million could be very nasty and most people could lose it all due to numerous snafus that will be lurking. Wake up and pay attention. There are so many potential ways we could fail.
Gold and silver appear to be entering a multi-years bull market. Gold might rise by 50% during next 18 months without the egregious level of volatility in BTC. Thus gold might be a suitable alternative liquid asset (aka currency) to sell the BTC top into (as many metals suppliers take BTC payments), if BTC exchanges will fail or be get caught up in capital controls, lawsuits, hacks, etc.. Remember BTC is here to destroy the status-quo including Wallstreet, not cooperate with it.
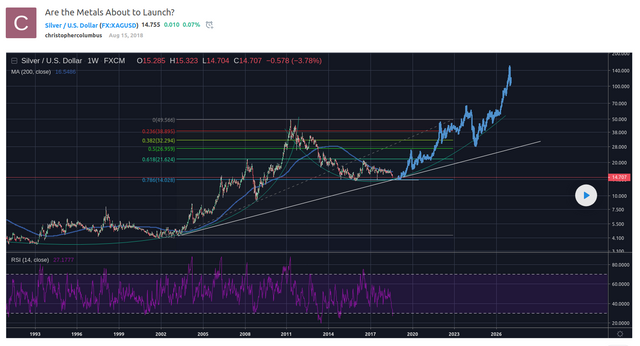
(click to zoom)
The BTC market cap may approach parity with gold’s on this next major high. So some flight from BTC into gold could help propel gold’s coming rise.
Exchanges might fail on the way up to $1 million. That might provide the additional fuel as the recent Bitfinex hack did, by causing the market to go irrationally short. Irrational because there are many alternatives now, unlike back in 2013 when Mt. Gox had 75% of all cryptocurrency trading volume.
[…] David Gerard wrote in his blog on Monday called the bitcoin price a “proxy for margin trading,” adding that one can make more money by manipulating the cryptocurrency’s “thin and ill-regulated market to burn the margin traders.”
Preston Byrne, partners at New York-based Byrne & Storm, built up to the scenario laid by Gerard, questioning why every bitcoin price boom coincided with a significant exchange(s) having “banking, withdrawal, and possibly solvency problems.”
Gerard iterated that he didn’t believe institutional investors were behind the bitcoin price explosion. Instead, it was the Bitfinex’s additional 800 million USDT supply
And don’t forget the potential “SegWit donations-to-miners” fiasco which could wreck exchanges. This probably won’t be in 2020, but could come after the next major peak.
Altcoins
As @infofront is quoted below as mentioning, I also posit that altcoins lag as they always do when BTC is rising fast, as can be confirmed on the LTCBTC historical chart.
Note altcoins have been losing leverage against BTC since roughly the start of April. Altcoins can lead BTC after an oversold bottom, but then they shift back to lagging again after the initial over enthusiasm. This pattern can clearly be seen on the LTCBTC chart for the prior cryptowinter.
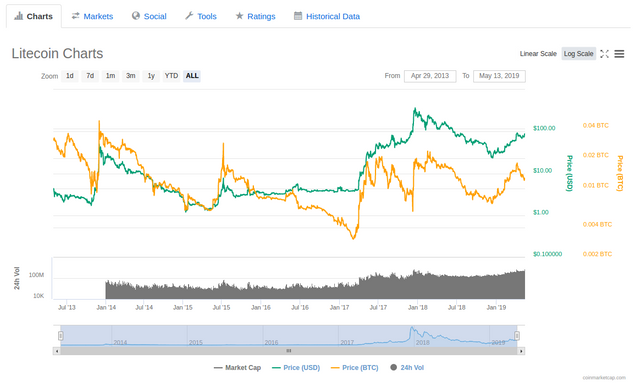
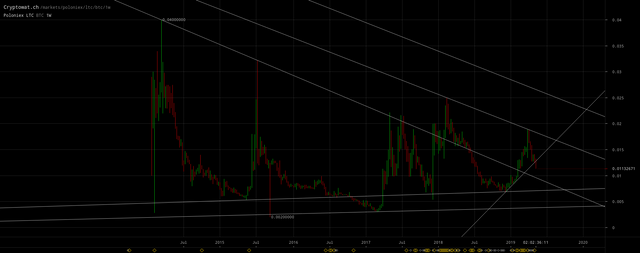
(click to zoom)
Also note LTCBTC has been losing leverage (i.e. decelerating, as spikes are lower) over time even though it’s highly volatile (i.e. spikes), which is expected by the S/Fs model. Presumably because rate of relative acceleration on the S/Fs model between LTC and BTC has narrowed.
Thus we can expect smaller and newer altcoins of merit to have miraculous leaps up in relative value to BTC during pauses and declines in the staircase ascent of BTC depicted in my model.
Discussion of other correlation, coincidences, and possible fundamental drivers
The high volatility (spikes, very fast rate of price ascent) staircase of 2010 and 2011 which I am positing will return (at a larger timescale, i.e. magnified) seemed to be indicative of price discovery, i.e. that BTC was undervalued and the market was trying to catch up fast to its “correct” valuation, but this was a chaotic frenzied process with much uncertainty. My theory is BTC is becoming extremely undervalued again as of 2020 because of the acceleration of the global sovereign debt crisis. Periodically (at lengthening intervals) we can expect the global economic situation to worsen, fiat to accelerate its worthlessness, and thus for BTC to lurch up suddenly in a catch up to its correct new valuation. The fundamental driver effect of halving and stocks-to-flows valuation is presciently correlated.
As ZeroHedge reported, we have the Chinese trying to prevent a strong dollar to ease the trade war and also conserve their dollars for lending to their Belt-and-Road initiative, which causing Chinese to resort to buying BTC to circumvent capital controls.
I also noted that the Bitfinex attack probably contributed to this rise from $6k to (currently $8k and probably going to at least) ~$10k, because it presumably precipitated the massively, disproportionately short position which forced BTC to rise and it also perhaps shut off arbitrage from a major exchange given Bitfinex has stopped all withdrawals for 7 days. Also massive volatility could wreck exchanges that offer leveraged margin trading.
@infofront wrote:
I'm thinking that for it to be possible from a fundamental perspective, we'll need ETFs and shit.
Look at all the current/upcoming mainstream platforms that Joe Six-Pack will have available to trade Bitcoin on: ETFs + Bakkt + Robinhood + TD Ameritrade + E-Trade + Fidelity
Not only will drastically improved trading infrastructure and tools bypass the shit exchanges we've had so far (not much better than Magic The Gathering Online eXchange), but the real big money will have the green light to get in. More cautious and technologically impaired investors will suddenly have the impetus to get in.
Couple that with the fact that altcoins may get left behind for a significant portion of the next bull run, and we're in for the mother of all bubbles.
Another curious correlation is that this posited crazy move up in the BTC price is coming right around the 2020 MAJOR turning point of Armstrong’s ECM model (distinct from Kondratieff waves), which has predicted many very important events (e.g. September 11, 2001 aka “9/11”, major political events and major market turnings) and 2020 should be a major shift and might be the start of a global monetary crisis with a crazy U.S.A. election in November 2020.
More to follow in a reply to this post because this post would otherwise have exceeded Steem’s annoying 16KB post size limit.