Evolution 101 #2 - Genotype, Phenotype, Genes, Alleles and Population Genetics Model
In this part of Evolution 101 series, I will introduce you to the "language" of population genetics and explain the basic population genetics model describing genotypes and allele frequencies in population.
Genotype, phenotype, genes, alleles
I'm sure that most of you have heard about those terms from the heading, but never really understood them, right?
Well, population genetics is not scary and difficult to understand as you may think! So let's start with the basics.
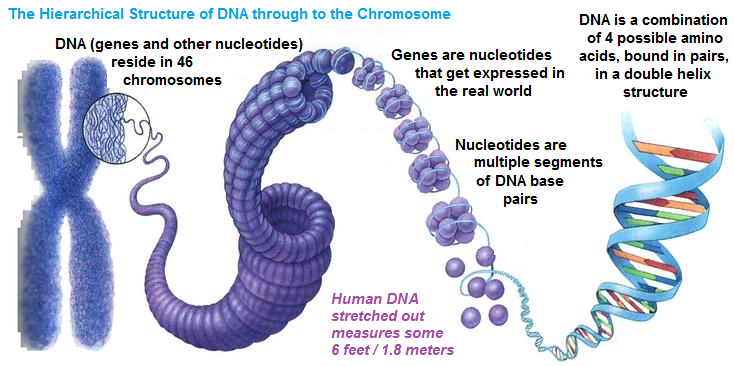
Chromosomes, DNA, genes, nucleotides
Source
Each of our cells (except mature red blood cells and dead cells in hair, skin and nails) contains 46 chromosomes which represent densely packed DNA, carrier of our genetic information.
DNA consists of building blocks - nucleotides (A, T, G, C, precisely 3 billion of these in pairs in our whole genome!), which are arranged in certain manner, forming sequences with specific functions, like genes.
According to general definition, genes are basic physical and functional units of heredity which means that they provide instructions for protein synthesis. The human genome consists of about 20 000 protein-coding genes.
Alleles are different forms of the SAME gene, meaning that they slightly differ among themselves in their nucleotide sequences.
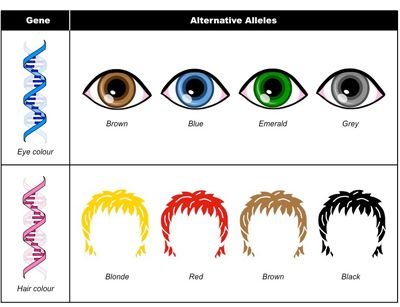
Gene coding for eye color can exist in different allele forms - brown, blue, green, etc.
Source
Genotype is complete heritable genetic information carried by the individual. However, it can also refer to set of genes which is responsible for development of certain characteristics.
Phenotype is basically everything you can observe in one organism - all morphological, physiological, biochemical and behavioral traits, and represents observable "consequence" of genotype expression.
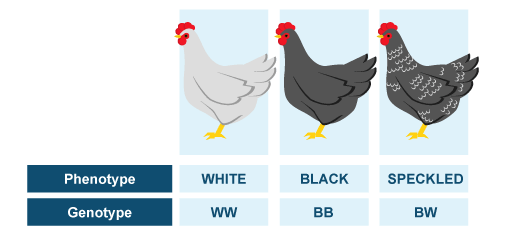
Difference between genotype and phenotype
Source
Population genetics - genotype and allele frequencies
I have already mentioned that human genome contains about 20 000 genes loci.
The simplest case which is often used to explain genotype and allele frequencies is example with one genetic locus which has two alleles (A and a) and consequently, there would be three possible genotypes within population (AA, Aa, and aa).
Frequencies of these genotypes can be expressed in following manner:
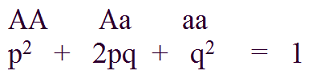
The sum of frequencies of all individual genotypes must be equal to 1 (or 100%).
For example, let's imagine population of 10 individuals, with genotypes:
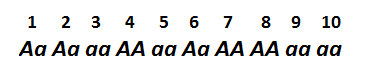
We can easily calculate genotype frequencies in this population:
Frequency of AA = 3/10 = 0.3 (or 30%)
Frequency of Aa = 3/10 = 0.3 (or 30%)
Frequency of aa = 4/10 = 0.4 (or 40%)
So genotype frequencies are calculated simply by counting the number of each genotype and diving it by the total number of organisms in population.
Likewise, allele frequencies are calculated by counting how many times each of the alleles appear in a population, and dividing that number with total number of alleles for that gene locus in population:
Frequency of A = 9/20 = 0.45
Frequency of a = 11/20 = 0.55
So in our imaginary population, allele A appears 9 times and allele a 11 times, in a population which has total number of 20 alleles for this gene locus.
Hardy–Weinberg principle and genetic equilibrium
The main question in population genetics is - if we know the genotype (and allele) frequencies in one generation, how can we predict those frequencies in the next generation?
To be able to make such assumptions, population geneticists need to use certain type of population model. This model assumes existence of "perfect populations", which of course do not exist in real life.
This is called Hardy–Weinberg principle and includes following assumptions:
- Hypothetical population is infinitely large
- Individuals of such population mate among themselves randomly (no mating preferences)
- Sex ratio is 1:1
- There are no overlapping generations
- There are no evolutionary mechanisms that could change the allele frequencies (no natural selection, no mutations, no migrations, etc.)
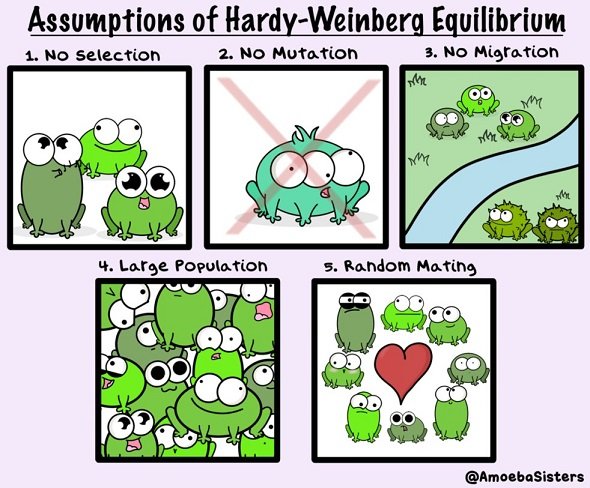
In Hardy–Weinberg "perfect" populations, there are no changes in allele frequencies throughout generations
Source
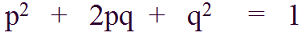
In such hypothetical population, genetic or Hardy–Weinberg equilibrium is achieved - allele frequencies stay the same throughout generations and genotype frequencies can be determined from allele frequencies.
What are the implications of hypothetical random mating? This implicates that after one generation of random mating, the Hardy–Weinberg genotype frequencies are reached regardless the initial genotype frequencies, and the population will stay in Hardy–Weinberg equilibrium as long as mating is random, the population size is large and there are no evolution mechanisms working to change allele frequencies.
In this state, we can easily calculate genotype frequencies from allele frequencies, by using already familiar equation:
Why is Hardy–Weinberg theorem important?
Although Hardy–Weinberg theorem can have prediction significance in some rare cases (MN blood group genotype frequencies in three American populations are very close to Hardy–Weinberg equilibrium), we cannot expect that real populations behave according to Hardy–Weinberg principle.
However, it represents a good starting point for investigation of real populations genotype frequencies. By comparison of real populations with Hardy–Weinberg ratios, we can observe in what level those real populations we're interested in deviate from the hypothetical population in equilibrium, and what evolution mechanisms are responsible for that deviation.
In the next post, we will start discussing about different mechanisms of evolution and in what way they change allele frequencies in population.
Until then, relax and keep steemSTEM! ;)
Literature
Evolution, Mark Ridley, 3rd Edition
For more scientific-related content check steemSTEM. Follow me if you like my posts and want to read some more ;) If you have any thoughts/suggestions fell free to leave a comment!
The post is at the same time introductory, yet delivers more in depth info that you'd expect. 👍
I liked the cryptofrogs comic! )
Hi @scienceangel there is a mistake in your article "nucleotides (A, T, G, C, precisely 3 million of these in pairs in our whole genome!)," It should be 3 billion not 3 million. Otherwise a very nice article.
Cheers!
ian
Thank you very much, mistake corrected! :)
Genetics is my favorite subject and reading articles like this really makes me regret not finishing my Biomedical science degree(
However, it's important to be able to present information in a simple way for the reader and you did a great job! Also, if you will have time, I would love to hear you thoughts in regards to advances in Nanorobotic's field(related to Cancer treatment).
Thanks so much, I checked the paper, it's totally new, published 10 days ago! I will read it for sure!
Do you have some means to quantify how large are the deviations from the Hardy-Weinberg principle, in real life?
Yes, and I will write in detail about this in the next post. Testing for deviations from Hardy-Weinberg proportions are usually made to check if there is a random mating present in populations with respect to a particular locus. If we know all the genotypes and allele types present in a population gene pool, we can easily calculate predicted, hypothetical (H-W) frequencies. After that, geneticists collect actual data and calculate observed, real frequencies of alleles and genotypes. The difference between predicted and observed frequencies is deviation from H-W. We know what events influence allele frequencies and in what way, so conclusion why the frequencies are changed can be made. For example, non-random mating increases frequency of the homozygous genotypes, which means that has an influence on genotype frequencies, however, it doesn't change allele frequencies. Unlike non-random mating, genetic drift ( sampling error from generation to generation, strong influence in small populations) will change the allele frequencies, which leads to deviations of H-W principle. All this with more math in the next post! :)
It was such a big step in undergrad, after learning the HW principle, to understand that it's a theory that only applies to a perfectly randomized allele in a population. I remember a lot of fellow students not getting this aspect of the principle and thinking it always explained the distribution of genotypes no matter what.
thanks for this already well detailed answer. I am looking forward to the next post (especially the math part which I like a lot) :)
+scienceangel, wow I must say you really nailed a great introduction to evolution post here. Hardy Weinberg in evolution 101 takes me back to my college days. Genetics is a key course for an in depth understanding to biology. But what level reader would you say this post is meant for? I feel like this is a good post for a high school science around 10th grade. I hope to see more work like this from you and I plan to pass this on to friends of mine who are big on science and evolution. Cheers!
Thank you for your comment! In my posts I usually try to make things understandable as much as possible for people who do not have formal education in biology, because I think that understanding evolution is very difficult for most people (even for biologists it's not easy!). In this post, I tried to make an introduction for next posts, where I will explain things on higher level and in more detail. So, I would say that this series of posts is meant for all people who want to learn something about evolution biology, and do not have formal education in biology. For scientists who are working in field of evolution biology, this is too basic.