Rise of the Feral Pigeons: Introduction to Leslie Matrices
We've seen in applied mathematics, there are several models for population growth of a species. In my own posts, I have briefly covered the natural (or exponential), logistic growth and predator-prey models.
So far, all of these models treat the population(s) in question as a homogeneous species. They don't take into account most species have 2 sexes (male and female), different age classes within the population and how reproductive rates may differ between them, nor any other factors that may affect the structure of a particular population.
It is intuitive to think that birth and death rates varying according to age.
For instance, we know that in our own human population, that women who are aged under 12 are much less likely to give birth to say women between the ages of 24 and 36. Women aged 37 to 50 are also less likely to give birth than the aforementioned group.
We also know that generally, you are less likely to die if you are younger. It is a fact of life that as a population gets older, the rates of death increase too. (Of course, there are some animals that oppose this trend, e.g. turtles as hatchlings have a much higher death rate due to predators, but those who survive go on to live very long lives).
So is there a mathematical model that can take some of these factors into account? Yes, there is!
Feral Pigeons running rampant in the City
Let's jump right into an example...
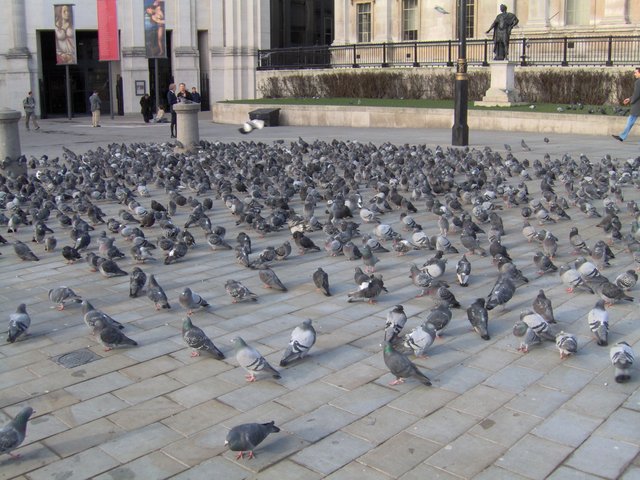
Figure 1. Feral Pidgeons in Trafalgar Square
Image Source: Wikimedia Commons
Over some time, data was collected by zoologists on feral pigeons living and breeding in a city. A snapshot of current age-structured population of the feral pigeons is detailed in Table 1.
| Age (years) | 0 - 1 | 1 - 2 | 2 - 3 | 3 - 4 |
| Population | 2500 | 1000 | 300 | 150 |
| Birth rate | 0 | 3.5 | 1.5 | 0.5 |
| Death rate | 0.6 | 0.5 | 0.7 | 1 |
Can we use this data to predict the population next year? Yes, we can!
First of all, we have the birth rates for each age class, so we can use this to predict how many new born feral pigeons will come into existance in the 0 - 1 age class at the end of the cycle (i.e. 1 year). We simply use the formula...
Table 2 below is the calculation for new pigeons that come into existence at the end of the cycle.
| Age: 0 - 1 | 0x2500 | + | 3.5x1000 | + | 1.5x300 | + | 0.5x150 | = 4025 |
The population is also increased by the number that survive from one year to the next. We've been given their death rates (i.e. the portion that die every year for each age class). Therefore the portion that survive and advance to the next age class is given by:
The survival rates according to age class are shown in Table 3.
| Age | 0 - 1 | 1 - 2 | 2 - 3 | 3 - 4 |
| Survival rate | 0.4 | 0.5 | 0.3 | 0 |
We can calculate the surviving population and add it to the new borns from Table 2. This is shown in Table 4.
| Age: 0 - 1 | 0x2500 | + | 3.5x1000 | + | 1.5x300 | + | 0.5x150 | = 4025 |
| Age: 1 - 2 | 0.4x2500 | = 1000 | ||||||
| Age: 2 - 3 | 0.5x1000 | = 500 | ||||||
| Age: 3 - 4 | 0.3x300 | = 90 | ||||||
| Total | = 5615 |
Note: in table 4, it is not necessary to calculate how many pigeons are aged 4 - 5 because we know from Table 1, they all die!
Thus at the same time next year (end of 1 cycle), we can expect the total number of feral pigeons in the city to be 5615, a whopping 42% increase. This is clearly going to be a problem that we'll have to deal with, and we'll get to that later.
But firstly, notice how the operations in Table 4 can be carried out as a Matrix-Vector multiplication.
Let X0 denote the initial population vector...

Let L be the "birth and survival" matrix.

L is called the Leslie matrix, invented by and named after Patrick H. Leslie. The Leslie model is commonly used in ecology, where age-structured changes in a species population are important. It conveniently generates population predictions in age classes.
Ok, let's verify that we get the same numbers after year 1 when we carry out the matrix-vector operation...
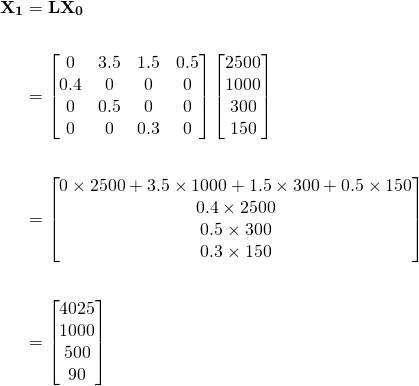
Great. We have matching numbers from Table 4 and population vector X1. So the Leslie matrix gives us a much more convenient way to calculate our predictions.
Assuming the conditions for the feral pigeons survival remain constant year on year, we can confidently make projections about their population well into the future. Here's the calculation for population X2, 2 years after the initial snapshot...

The total population from X2 is 4295+1610+500+150 = 6555, which is an increase of 16.7% from X1.
After 3 years...

The total population from X3 is 9133, a 39.3% increase from X2.
After 4 years...

The total population from X4 is 10980, a 20.2% increase from X3.
I think you're getting the picture that we can iterate this operation indefinitely. A 22 year prediction for city pigeon population is shown in Figure 2 below. The growth is reminiscent of the exponential model.

Figure 2. Growth in Feral Pidgeon population over 22 years
Now, of more interest is the percentage change in population year by year shown in Figure 3.
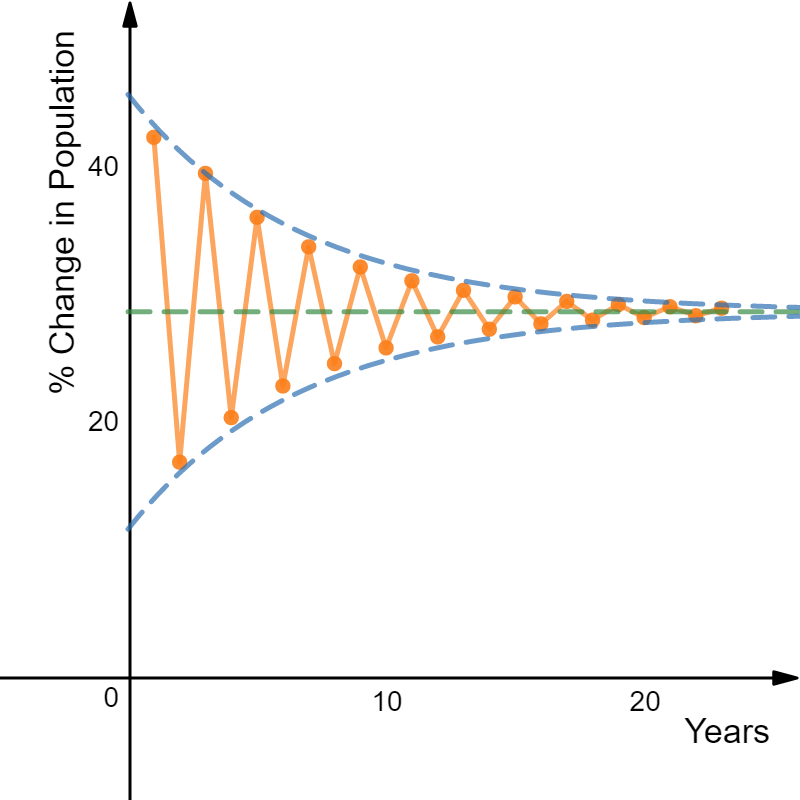
Figure 3. Percentage increase in Pidgeon population year by year
The population is increasing, and thus the percentage change is always positive. But the growth rate fluctuates wildly between the 2 blue dashed regression lines in the early years before it converges to constant growth of about 28.5% per year. Knowing this will be important in my next post on strategies for population control.
Finally, since age-structure is one of the hallmarks for the Leslie model, let's have a look at how the population is spread across the age-classes as time passes on...

Figure 3. Distribution of Pidgeon population across age classes
Thus we can see that eventually, the population distribution settles to about...
- 68.4% aged 0 - 1
- 21.4% aged 1 - 2
- 8.2% aged 2 - 3
- 2% aged 3 - 4
In the next post, we'll look at mathematical strategies for population control.
Credits:
All equations in this tutorial were created with QuickLatex
All graphs were created with www.desmos.com/calculator
Please give me an Upvote and Resteem if you have found this tutorial helpful.
Please ask me a maths question by commenting below and I will try to help you in future videos.
I would really appreciate any small donation which will help me to help more math students of the world.
Tip me some DogeCoin: A4f3URZSWDoJCkWhVttbR3RjGHRSuLpaP3
Tip me at PayPal: https://paypal.me/MasterWu
I never heard about Leslie matrices. Nice post.
I just realized that the growth is determined by the maximal eigenvalue since you can write L=X J X^-1 where J is the Jordan normal form. Then L^n=X J^n X^-1 so
where lambda max is the maximal eigenvalue and C is a positive constant. So you only need to compute the maximal eigenvalue to find out what happens to the pigeons.
You stole my thunder haha! That's going to be the topic of my next post!
This is super interesting and very explained @masterwu and not a super maths-y person. My only question is, at some point population growth will stall because of environmental factors (not enough food to support them all comes to mind). I'm wondering how that fits into this? Or do you capture this in your next post?
Was going to post this question myself. I guess there would be an increase in predators as well.
Hey @choogirl! Thanks for your comment. It's great to have you stop by. You're right, the population growth will stall due to the factors you've mentioned, but that's one of the limitations of this model because at this level it doesn't take these factors into account. We would need a more sophisticated model.
However, I'm guessing the sheer number of pigeons will become problematic before we get to levels where their growth naturally stalls. So my next post will be about controlling population through (sadly) culling. I guess that's an environmental problem we've created for ourselves by providing them with such an abundant environment :)
You've got our team services. [@steemsoul--@rayhanahmed--@shahanasayan--@raselhossain] Thanks for using our service.
Totally wish I knew about you @masterwu when I was still taking math classes in undergrad
Haha, cheers mate! Never too late to start learning this stuff again. I've been slack with my bike posting (and fitness in general) - gotta get back to that soon.
your math is above average.. and your analysis is genius!....wow!.. and I am nailed to highschool math... 😰
Thank you @fabio2614. I'm glad my math is above average :)
a hahaha..stand corrected..hmmm.. I think I've used the wrong word..your math actually is almost perfect..as I dig on your post ...wow you are genius!
If you just know ...I can hardly grasp the other post..it's so deep...superb!
Thank you. Keep following all the wonderful math bloggers here on Steemit. You'll eventually become a genius yourself!
Congratulations! This post has been upvoted from the communal account, @minnowsupport, by masterwu from the Minnow Support Project. It's a witness project run by aggroed, ausbitbank, teamsteem, theprophet0, someguy123, neoxian, followbtcnews, and netuoso. The goal is to help Steemit grow by supporting Minnows. Please find us at the Peace, Abundance, and Liberty Network (PALnet) Discord Channel. It's a completely public and open space to all members of the Steemit community who voluntarily choose to be there.
If you would like to delegate to the Minnow Support Project you can do so by clicking on the following links: 50SP, 100SP, 250SP, 500SP, 1000SP, 5000SP.
Be sure to leave at least 50SP undelegated on your account.
You got a 1.52% upvote from @allaz courtesy of @masterwu!
You got a 1.21% upvote from @mercurybot courtesy of @masterwu!
You got a 1.72% upvote from @buildawhale courtesy of @masterwu!
If you believe this post is spam or abuse, please report it to our Discord #abuse channel.
If you want to support our Curation Digest or our Spam & Abuse prevention efforts, please vote @themarkymark as witness.
I have a question, if the age is from 0-2 for example, would i have to add the birthrates together or average them?