How to live healthy? Part 4: How can I get to the truth?
Today we will talk about the traps of statistics which can lead to wrong assumptions about what's really going on.
These insights are of huge importance because we will need this knowledge for the 5th part where we will discuss the current view on healthy living and beyond based on scientific research.
In the German version, however, this article was too much overloaded with mathematics & co. Low reply frequency has indicated that most readers were overwhelmed by the content.
Because of this reason, I will change the structure of this article a bit. Instead of explaining the entire background, I will solely show you a fantasy study I created and want to explain how a lack of knowledge and targeted manipulation can change the outcome of a study.
At first, you have to know that statistical analyses are more a novel tool in science and economy. Before the 20. century the most scientific discoveries were not statistically evaluated.
Newton, Kepler, Galileo & Co. never did any statistics to find out whether their results are true or not.
Actually, the first statistical analysis was born in a brewery to estimate whether the suppliers of barley have a reliable quality. This test, by William Sealy Gosset, was invented in the Guinness brewery and is called the student's t-test because it was published anonymously.
It is important to understand that this test doesn’t tell you anything about what is wrong and what is right. These tests solely allow you to give you an impression whether a certain procedure could make potentially sense or not.
To get a feeling about the quality of the results obtained in an experiment or in a comparison you use the so-called p-value.
Unfortunately, the calculated p-value is today something like the gold standard in the most scientific fields. To realize this, an arbitrary border (p < 0.05) was defined which indicates whether you can trust results or not.
Are you below that border, you did a good job! But when you are above the border, you have found no effect.
But to prevent the same mistake as in the German version let's go directly into the data to show you some of many problems, statistical analyses, and the p-value has.
Fig.1 What harms your health more? Facebook or Steemit? Made by Chapper - unrestricted use allowed
Imagine you want to find out whether social media networks have an impact on your telomere length.
Remember that telomeres are the endpoints of your chromosomes which can be shortened upon stress.
Now you want to compare two networks: Facebook and Steemit.
The first error occurred!
Why?
Just because you can't compare Facebook and Steemit due to the size of the network. 2 billion vs. 1 million users! How can you find a comparable amount of participants? On the other hand, the user profile of Facebook users is probably quite different from the profile of Steemit users. Due to the size of the network, Facebook users are probably more average while Steemit users are of course a bit more special (not at least because of the size 😉). That means the selection of participants is the first problem (besides the fact that you have no control group of people who are no users of social media networks).
Ok, let's assume you challenged this problem and found comparable groups. The next obstacle is to carry out the measurement of the telomeres in an appropriate manner. That means no significant changes should occur in the experimental procedure. Everything must be comparable.
But how can be guaranteed that all participants were equally treated?
Ok, we are professionals, therefore we solved these problems easily and did everything in the same manner. Everything was successful, and all the data are now present on our computer screen.
But what is this?
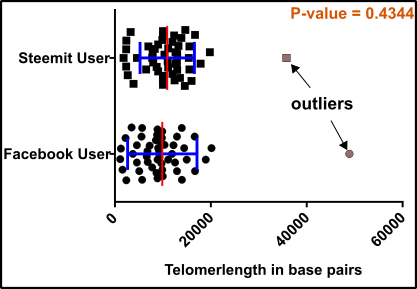
Fig.2 All data! Data points for test = black squares and circles; Outliers = gray squares and circles; Mean (red) +/-standard deviation (blue). Note that usually in analyzes like this the standard error is used. An unpaired, two-tailed student’s t-test was used for evaluation. Made by Chapper - unrestricted use allowed
On the first glance, all participants have a comparable telomer length, but some data points are somehow obscure.
Now the trouble with the statistics begins!
Should you eliminate the two outliers, or should you keep them where they are?
Ok, you decide to remove the outliers from the graph and proceed with your analyses.
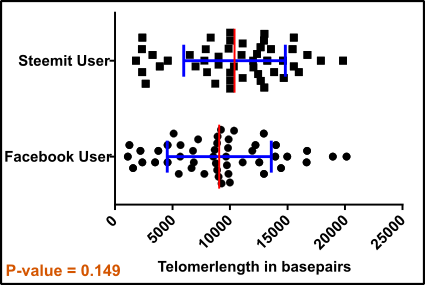
Fig.3 Outliers eliminated! Data points for test = black squares and circles; Mean (red) +/-standard deviation (blue). Note that usually in analyzes like this the standard error is used. An unpaired, two-tailed student’s t-test was used for evaluation. Made by Chapper - unrestricted use allowed
After removing the outliers your p-value is 0.149 which is a way too high because the lower the p-value the better your result or the more likely is a difference.
And this is the first misassumption:
Even though p stands for probability the p-value never tells you how likely a difference really is. He just tells you how "probable" it is that a presumed positive result is actually wrong. And even this is not a complete finding because the border is set arbitrary.
It is important to keep in mind that you can’t suppose that the p-value indicates something like a real statistical significance.
It just gives you a raw feeling whether a presumed positive result might be misleading. That’s it.
Anyway!
Many people would say something like: “Ok we see a difference somehow, but the p-value doesn’t fit the criteria the journals have. What can we do to fix this?”
Now would someone say: “I remember a study of the most common telomere lengths. Let’s use them to exclude some of our data points, maybe our results are “better” afterward!”
Ok, you look for a publication and eliminate all data which are not supported by previous studies.
According to Samassekou et al. 2010, you roughly found that telomeres in the fetus are about 13 kb long and in cells which are almost dead, the telomere length is not more than approximately 6 kb [1].
Well, then fix this: ”We just eliminate all targets less than 5 kb or larger than 13 kb.”
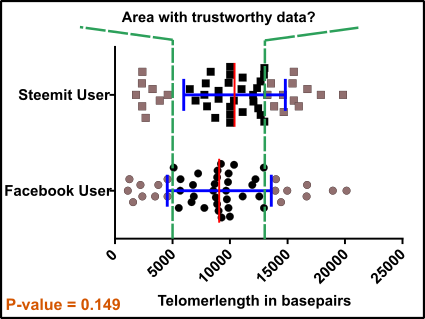
Fig.4 Enemy sited! Data points for test = black squares and circles; Enemies of success = gray squares and circles; Mean (red) +/-standard deviation (blue). Note that usually in analyzes like this the standard error is used. An unpaired, two-tailed student’s t-test was used for evaluation. Made by Chapper - unrestricted use allowed
Targets spotted…. And…. Done!
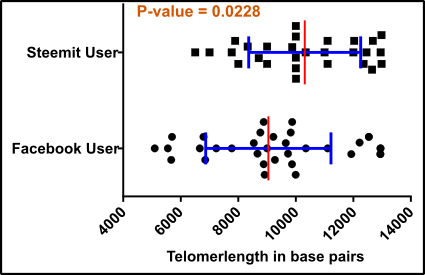
Fig.5 Targets successfully eliminated, Sir! Data points for test = black squares and circles; Enemies of success = gray squares and circles; Mean (red) +/-standard deviation (blue). Note that usually in analyzes like this the standard error is used. An unpaired, two-tailed student’s t-test was used for evaluation. Made by Chapper - unrestricted use allowed
Even though you removed all the presumed “not possible” results your p-value is still too high (0.0228). Ok, the p-value is lower than 0.05 which is in accordance with some mysterious laws something like a prove for the truth. But your group leader, want to have much better results and forces you to find a solution for this “problem”.
A lot of money was invested in this project, a lot of people are looking on your upcoming report, your career, your future, and the future of everything depend on a 100% “significant” result.
And now it’s getting pretty nasty. Because you start (in principle you did it already the whole time) something which is called P-Hacking. Just by removing some unwanted data points you bring your p-value in the right shape.
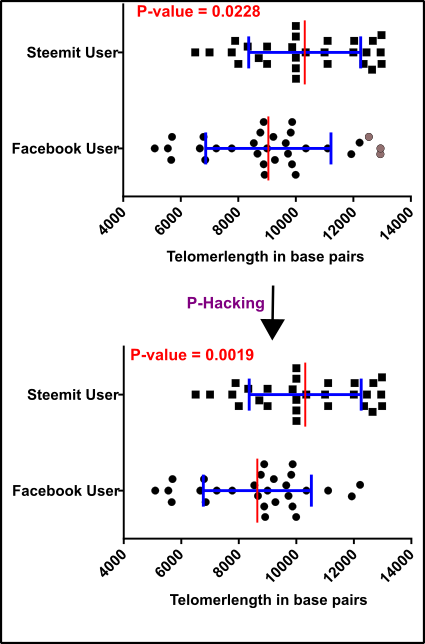
Fig.6 P-hacking successful! Data points for test = black squares and circles; Outliers = gray squares and circles; Mean (red) +/-standard deviation (blue). Note that usually in analyzes like this the standard error is used. An unpaired, two-tailed student’s t-test was used for evaluation. Made by Chapper - unrestricted use allowed
Congratulation you produced…
… NO contribution to science!
That’s the curse of the p-value!!!
And the tragicomedy is not over now because now your study is published and the most people say: “Wow look at this, the p-value is only 0.0019 which means it was clearly shown that Steemit causes a lower stress burden then using Facebook.”
But actually, nothing was shown:
- The participants you have chosen can’t be compared that easy
- You forgot an important control (the non-users)
- The way the telomere lengths were measured could differ
- The entire statistical evaluation was just undertaken to receive a low p-value
- Not enough references were used
- Eventually, you discarded data points just for “better” results
- and the remaining stuff looks so comparable that no one should rely on these data
- moreover, you did not check whether a t-test can be used in this kind analyses
The whole study is therefore for the trash bin, but the p-value will spread your results around the globe and maybe next week you will hear in a TV show that it is not recommended to use Facebook anymore because it makes your telomeres short and thus causes an early painful death!
Indeed, within the years' many battles were fought because of the p-value. Today the p-value is considered a serious threat for sciences [2] (please see also Wasserstein und Lazar 2016).
In my opinion, most scientists try to do their best to handle their results with care. Sometimes it’s probably hard to estimate where a p-hacking starts. Further, it is important that the readers of scientific studies also contribute to the outcome of a study. For instance, by critically assessing the merit of a study.
The best solution for the problems could be the blockchain technology.
Imagine an independent open network where every data point is stored. Everyone see when data were collected and how they were further processed. Eventually, an artificial intelligence makes the final assessment. No one else is involved, no one else can change or exclude something.
Is the blockchain technology the solution to realize the perfect science?
What do you think?
I hope it was understandable so far and you have more confidence in science now solely by taking the responsibility just by assessing what you read with more care.
Have a nice start in the week
The final article will probably not be published next week because I’m on travel this week until Sunday.
See you in two weeks
Regards
Chapper
References
Many information I got from a magazine called “STATISTIK – Zahlenspiele mit Mehrwert” (Spektrum der Wissenschaft KOMPAKT 2.18). Unfortunately, this magazine is solely available in German.
Further reading:
- Samassekou, O., et al., Sizing the ends: normal length of human telomeres. Ann Anat, 2010. 192(5): p. 284-91.
- Ioannidis, J.P., Why most published research findings are false. PLoS Med, 2005. 2(8): p. e124.
- Cann, A.J., Mathe für Biologen. 2004: Wiley-VCH Verlag GmbH & Co. KGaA, Weinheim.
That's quite the topic of interest to me, health in general. Nutrition specifically. So little appears to be known about what we should eat. I have an autoimmune disease that I improved solely through diet and exercise, and I'm currently (as of yesterday!) following the Wahls Protocol diet. Often I wonder about the scientific evidence for any of it, but we have to made do with what we have.
The general topic of your current post is important, too. I meet with the p value all the time in the articles i read to write my posts. Your A.I. solution appears quite sensible and attractive!
Readers are probably not flocking to your post simply because it's math-heavy, and making it math-light is still too much math for many!
Keep up the good work!
Hey @alexander.alexis,
thank you for your kind reply.
This is really hard but it's good that you are actively trying to help yourself. I also know people with problems like this and all what they do is taking medication. The results are not that presentable.
Please check also my article about caloric mimetics restriction.
Maybe there is additional valuable information for you.
Have a nice start in the week
and
Beam Da Steem
Chapper
Looks like 1 FB and 1 Steemit user need a visit to the oncology ward
Now for a more serious comment.
It would be interesting to see actual examples of how published research in accredited journals was p-hacked.
Your posts are fascinating non the less! Keep 'em coming!
I have a very weak background in math and yet had no problem following your argument. It's not necessary to understand p-values to spot the design flaws in the study you describe. Every time there was a difficulty, instead of acknowledging the issue, there was a work around: Get rid of the outliers; 'somehow' come up with comparable Steem and Facebook users; eliminate telomere measurements that fall on either end of the spectrum (We just eliminate all targets less than 5 kb or larger than 13 kb). The whole process sounded like an outcome in search of a study.
I enjoyed the blog, and as has been true many times in recent years, wish I had not dodged all those advanced math courses.
Hey @agmoore,
thank you for reply, resteem and upvote.
Nevertheless, even without a huge mathematical background, almost everyone can understand where the problems and potentials of statistics are.
I'm happy that I received that goal and even people with (as you said) weak mathematical background enjoyed this article.
All the best
Chapper
Thank you for that gracious response :)
first: great job as allways!
statistics in general is not about showing relationships. Its about reducing noise and taking out the annecdote from a statement.
one can easily have two not correlated parameters and will get a correlation according to p-value. The smaler the sample the easier it is. So over one half of findings is likely to be false and only noise. But since there are big trials with thousands of individuals, there is signal in science. But probably they realy should abandon the p-values from smal studys.
Hey lauch,
thanks for your reply.
I think this is worst of the worse!
How can someone know whether two changing parameters are correlated? How can they exclude that other parameters are responsible and the presumed correlation is just, as you said, "noise"?
The p-value suggests a scientific fundament which doesn't exist.
That's why I wrote it's important that also the readers should use their brains.
Let's see where this ends.
Best
Chapper
This post has been voted on by the SteemSTEM curation team and voting trail in collaboration with @utopian-io and @curie.
If you appreciate the work we are doing then consider voting all three projects for witness by selecting stem.witness, utopian-io and curie!
For additional information please join us on the SteemSTEM discord and to get to know the rest of the community!
Hi @chappertron!
Your post was upvoted by Utopian.io in cooperation with @steemstem - supporting knowledge, innovation and technological advancement on the Steem Blockchain.
Contribute to Open Source with utopian.io
Learn how to contribute on our website and join the new open source economy.
Want to chat? Join the Utopian Community on Discord https://discord.gg/h52nFrV