Spectroscopy Series VOL. 8: FT-IR spectroscopy
Welcome friends to a new installment of my spectroscopy series, where in this opportunity I will talk about FTIR spectroscopy, its acronyms refer to the Fourier transform infrared spectroscopy, is a measurement technique based on IR spectroscopy although it has some characteristics that They differentiate it from the infrared technique and it is the use of a totally different measuring device and a mathematical process is used that transforms the obtained data without processing the real spectrum. The main function is to register the infrared spectra of absorption or emission, since be it a solid, liquid or gas.
But before starting the content of this publication I suggest you visit my previous deliveries:
Now the definition is the following:
Infrared spectroscopy is a technique that allows to study the vibration and rotation of the molecules in the infrared region of the electromagnetic spectrum.
In the previous post talk about IR (infrared) spectroscopy that basically consists of the molecular study of infrared radiation, where the molecules absorb the radiation and then turn it into heat.
But to differentiate both techniques we should know the following:
The main objective of FTIR spectroscopy is to measure the absorption of light through a sample, this is translated as follows: how well can light absorb the material we want to analyze ?. And we know that in order to answer this question, scientists have used dispersive spectroscopy over the years, which makes a monochromatic light beam shine in the sample, then it measures the amount of light absorbed by the sample and repeats itself to each different wavelength.
For the study of materials using this technique, the specialized equipment or FTIR spectrometer must collect at the same time and without interruptions a series of data from a spectral region with a very high resolution, this means that the FTIR technique has a considerable advantage over the dispersive techniques due to the fact that through this spectrometer we can collect data of a wide spectral range.
It is very simple to explain how the FTIR spectrometer works. First we must have a sample, then we must proceed to perform a data collection through the signal generated by the material analyzed by means of an interferogram, we go to the next stage where we must perform the final analysis through the Fourier Transform and Finally, we obtain our spectrum from the infrared range.
A FT-IR spectrometer collects and digitizes the interferogram, performs the FT function and displays the spectrum.
But it would be important to go completely to the study of this technique and describe it step by step...
Then let's start :)
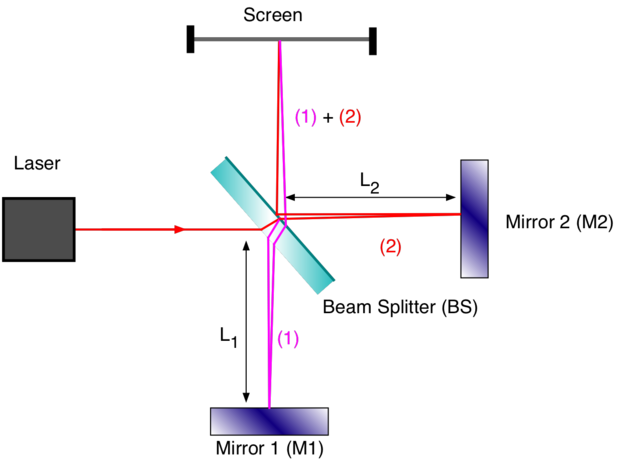
The first thing we must take into account to know well how the FTIR spectroscopy technique works, which is usually based on the experimental configuration of the Michelson interferometer, remember? mmmm I think not! many months ago was that I post a post about Michelson! I think at the end of 2017.
Let's return to what we came!.
The configuration of the interferometer is simple and many of us may know it, it contains a beam splitter that is responsible for transmitting and reflecting 50% of the incident radiation, a fixed and a movable mirror.
The basic principle of this configuration is that the beam splitter that transmits half of the light and the other reflects it, this light or radiation from the source hits the beam splitter separating them into two equal parts, one beam is transmitted through From the splitter to the fixed mirror and the other to the movable mirror, these mirrors reflect the light towards the beam splitter again and half of this reflected light is transmitted and the other half is reflected to the beam splitter. It is practically a round trip of radiation through the Michelson interferometer which results in one beam of light passing to the detector and the other returning to the source.
Michelson interferometer scheme Licensed CC BY-SA 3.0
The basic principle of this configuration is that the beam splitter that transmits half of the light and the other reflects it, this light or radiation from the source hits the beam splitter separating them into two equal parts, one beam is transmitted through From the splitter to the fixed mirror and the other to the movable mirror, these mirrors reflect the light towards the beam splitter again and half of this reflected light is transmitted and the other half is reflected to the beam splitter. It is practically a round trip of radiation through the Michelson interferometer which results in one beam of light passing to the detector and the other returning to the source.
In this experiment, an optical path difference called OPD is generated, which is the difference between the two light beams that travel through the interferometer. This is the product of the distance traveled by the beams through the moving mirror, then multiplying by 2,4,6 or another serious multiplier, which is the number of reflective elements that we use during the measurement and n the refractive index of the medium. All these raw data consist of pairs of OPD signal values.
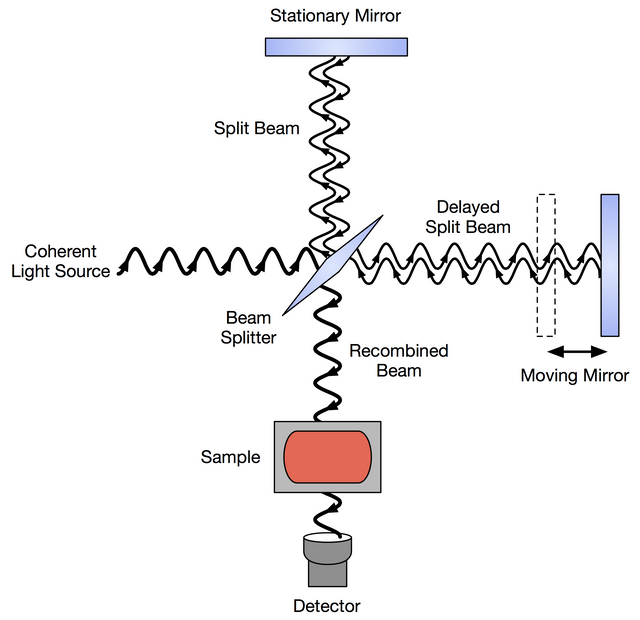
Interferometer for FTIR Licensed CC BY-SA 3.0
Important to mention about the process of measurement and processing through this interferometer and is that you must have a point of reference at the time that the fixed and moving mirrors are in the distance to travel the beam splitter, this condition is called As displacement of the movable mirror, we can obtain Δ.
The difference of the optical difference can be written through this expression: OPD = 2Δn.
The interferogram is the format of the signal emitted by the spectrometer. When the difference OPD of different wavelengths produce peaks in different positions for a broadband signal, they do not return to reach the peaks again at the same time, this means that we move away from the center and the function of the interferogram is to convert the signal that is oscillating frequently that is quite complex in a signal with a decreasing amplitude. As I mentioned in previous articles, this interferogram is the fingerprint of the material analyzed, you can also obtain a different format similar to other techniques depending on the equipment that we use, this format can be a spectrum as such.
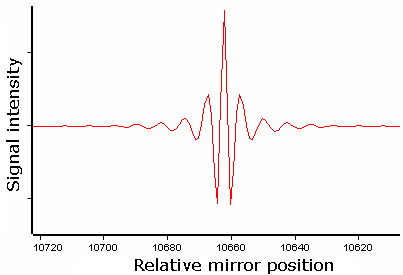
Interferogram measured with a FTIR spectrometer Licensed CC BY-SA 3.0
When obtaining an interferogram from a wide-band light source, in the central explosion, as shown by the interferogram, there is a broadband source, this translates into the fact that all the wavelengths that run along the path of the interferometer are in the phase of the ZPD path difference, the contributions to the maximum what produces an extremely strong signal as seen in the figure.
The X axis of the interferogram represents the difference of the optical path. Each individual spectral component provides a single sinusoid with a frequency inversely proportional to its wavelength at this signal. This leads us to the definition of the spectral unit of measure: the wave number (cm -1), denoted as n. A wave number represents the number of complete waves of a particular wavelength per cm of length (usually in a vacuum, where the refractive index n = 1). The advantage of defining the spectrum in wave numbers is that they are directly related to energy levels. A spectral characteristic at 4,000 cm -1 of spectral location represents a transition between two molecular levels separated by twice the energy of a spectral signature transition at 2,000 cm -1.
The essential part of this technique by which it receives the name of Fourier Transform and makes it different from the others, is that once all the measurement data have been collected through the interferometer and finally have the interferogram or FTIR spectrum, it must be start the conversion through the algorithm of the fourier transform, the spectrum of either absorption, emission or transmission is obtained from this transform that is used to calculate signals and digital filtering in general to the resolution of partial differential equations or the algorithms of rapid multiplication of large integers.
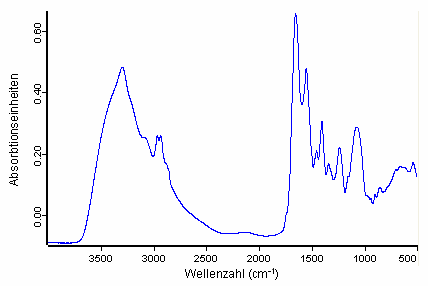
Spectrum measured with a FTIR spectrometer Licensed CC BY-SA 3.0
We must take into account certain very important details when making this type of calculations, because many mathematical calculations involve steps to obtain the spectrum, a small error brings fatal errors. This is where the configuration of the equipment plays a fundamental part to obtain viable results, since the imperfections and limitations of the equipment must be adapted to the steps of phase correction and improvement. Said electronic and optical imperfections can cause time or phase delays of some spectral components. A process of improvement is used to correct problems regarding spectral leakage that consists of the creation of certain characteristics that are coupled to the spectra in the exploration at its limits, then the Fourier Transform plays an important role because it will have a very broad spectral content.
The interferogram in practice consists of a set of measured intensities for discrete values of delay. The difference between the successive delay values is constant. Therefore, a discrete Fourier transform is needed. The Fast Fourier Transform (FFT) algorithm is used.
The FT-IR are capable of high resolution because the resolution limit is simply an inverse of the optical path difference achievable, OPD. Therefore, an instrument with an OPD capacity of 2 cm can reach a resolution of 0.5 cm -1.

FTIR spectrometer (seen from inside) Licensed CC BY-SA 3.0
The FTIR spectroscopy has great advantages. This has a frequency channel called multiplex that collects the information of all the wavelengths simultaneously, the multiplex also shared with other PDA and CCD detectors. In a dispersive spectrometer the wavelengths are observed sequentially unlike what I just noted the FTIR record everything simultaneously as it is scanned in the grid.
At the same time FTIR spectrometers do not need slits so they can obtain a resolution, this has as a consequence that in the FTIR the performance is much higher than the dispersive spectrometer, where this is called the Jacquinot advantage because the monochromator It contains inlet and outlet slots that record a good amount and quality of light that passes through the monochromator.
The performance of the interferometer is determined only by the diameter of the collimated beam that comes from the source. Although no slots are required, FTIR spectrometers require an aperture to restrict the convergence of the collimated beam in the interferometer. This is because the converging rays are modulated at different frequencies as the path difference varies. Such opening is called Jacquinot stop. [1] For a given resolution and wavelength, this circular aperture allows more light to pass than a slit, resulting in a higher signal-to-noise ratio.
And finally, it has a high spectral resolution and is easy to calibrate since a laser beam containing a known wavelength is needed and this is calibrated through the interferometer when the light beam passes through it and is located in the center , presents greater stability and precision than dispersive spectrometers.
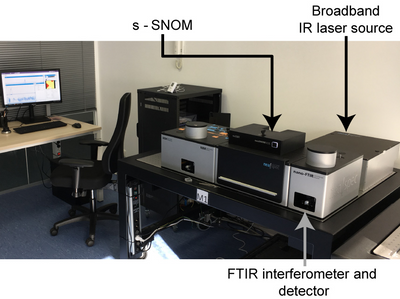
A modern nano-FTIR setup with the main components marked by arrows Licensed CC BY-SA 4.0
It has a great diversity in its applications, many are used in biological materials to study proteins.
Quality control of various liquid, solid and gaseous materials, especially polymers, rubbers, among others.
It is also used to analyze thin layers and coatings of chemical compounds, organic synthesis. In the same way, it is widely used in the pharmaceutical industry to verify medicinal components, vitamins, etc. Microanalysis of small sections of materials to identify contaminants. Monitoring of automotive emissions or chimney. Estimation of air pollutants from industrial processes. Various nanomaterials and much more.
Here is a video of how to prepare a sample for FTIR spectroscopy measurements.
If you want more information about the subject you can visit the following links:
Fourier-transform infrared spectroscopy
INTRODUCTION TO FT-IR SPECTROSCOPY
Fourier-transform spectroscopy
Crash Course in Fourier Transform Infrared Spectroscopy
How can i use FT- IR spectroscopy in quantitative analysis?


Video credits @gtg
il like
Congratulations @carloserp-2000! You have completed the following achievement on the Steem blockchain and have been rewarded with new badge(s) :
Click here to view your Board
If you no longer want to receive notifications, reply to this comment with the word
STOPThis post has been voted on by the SteemSTEM curation team and voting trail in collaboration with @utopian-io.
If you appreciate the work we are doing then consider voting both projects for witness by selecting stem.witness and utopian-io!
For additional information please join us on the SteemSTEM discord and to get to know the rest of the community!