Liquid STEEM Report June 23, 2018
This is a historical graph of both Total STEEM and Liquid STEEM supply
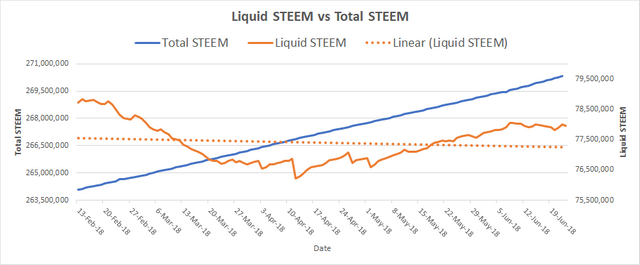
Liquid STEEM is the remaining STEEM that has not been converted into Steem Power. (Orange Line)
- When STEEM is liquid, it can be readily sold and purchased. When locked away in SP, it is not liquid, It takes a significant amount of time to convert it back to a liquid form.
The linear line (dotted line) is a line fit to the Liquid STEEM to show if Liquid STEEM is going up or down over the entire time period.
I created this chart with data that I collected over the last few months.
Why is this graph important?
STEEM is created at a high rate. Currently 8.85% per year. Many Steemians have a concern about STEEM inflation with the high rate of new currency creation. This graph shows since February, more STEEM has been converted to SP than new STEEM creation. This means that even with the high rate of new STEEM creation, the available supply has decreased.
---------------------------------------
For a breakdown of how Steemit Rewards system works:
https://steemit.com/steemit/@socky/steemit-rewards-breakdown-a-simplified-explanation-with-illustrations
For a breakdown of Steemit Keys:
https://steemit.com/life/@socky/do-you-understand-your-steemit-keys
thank you for share it
glad you liked it. What do you think about the amount of STEEM users are buying up and storing into SP?
Steem is one of the best cryptocurrencies according to this graph. And it will go up and up #steem #cryptolove