MEASUREMENT OF PERFORMANCE: SHARPE RATIO (Does the extra risk always worth it?)
Today's post is about Sharpe Ratio, developed by Nobel laureate William F. Sharpe.
After the recent post I made about PinkCoin I realized that would be very ilustrative to show some measurements of good risk management and money management strategies.
Check out PinkCoin analysis:
https://steemit.com/steemit/@luiggih/technical-analysis-pinkcoin-pink-btc-2500-return-in-60-days
What is the 'Sharpe Ratio'
The Sharpe ratio is the average return earned in excess of the risk-free rate per unit of volatility or total risk. Subtracting the risk-free rate from the mean return, the performance associated with risk-taking activities can be isolated.
One intuition of this calculation is that a portfolio engaging in “zero risk” investment, such as the purchase of U.S. Treasury bills (for which the expected return is the risk-free rate), has a Sharpe ratio of exactly zero.
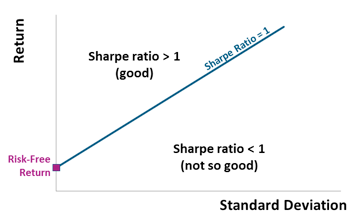
Generally, the greater the value of the Sharpe ratio, the more attractive the risk-adjusted return.
Basically the Sharpe Ratio measures the excess of return per unit of risk. Increasing risk does not always lead to higher return.
The Sharpe ratio has become the most widely used method for calculating risk-adjusted return; however, it can be inaccurate when applied to portfolios or assets that do not have a normal distribution of expected returns.
Many assets have a high degree of kurtosis ('fat tails') or negative skewness.
Most assets do not follow a normal distribution. This mean Sharpe Ratio needs to be taken carefully and dependant to each particular portfolio.
The Sharpe ratio also tends to fail when analyzing portfolios with significant non-linear risks, such as options or warrants
Modern Portfolio Theory states that adding assets to a diversified portfolio that have correlations of less than 1 with each other can decrease portfolio risk without sacrificing return.
Diversification is key to achieve higher Sharpe Ratios
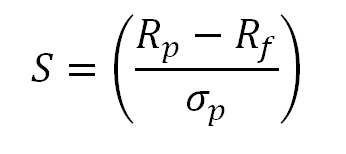
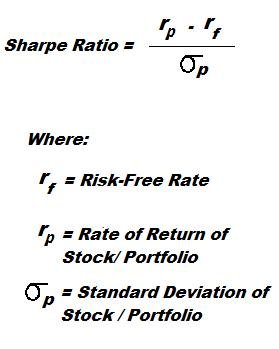
Sharpe ratio = (Mean portfolio return − Risk-free rate)/Standard deviation of portfolio return
Formula and elements of the Sharpe ratio
Applications of the Sharpe Ratio
The Sharpe ratio is often used to compare the change in a portfolio's overall risk-return characteristics when a new asset or asset class is added to it.
For example, a portfolio manager is considering adding a hedge fund allocation to his existing 50/50 investment portfolio of stocks and bonds which has a Sharpe ratio of 0.67. If the new portfolio's allocation is 40/40/20 stocks, bonds and a diversified hedge fund allocation (perhaps a fund of funds), the Sharpe ratio increases to 0.87. This indicates that although the hedge fund investment is risky as a standalone exposure, it actually improves the risk-return characteristic of the combined portfolio, and thus adds a diversification benefit. If the addition of the new investment lowered the Sharpe ratio, it should not be added to the portfolio.
The Sharpe ratio can also help explain whether a portfolio's excess returns are due to smart investment decisions or a result of too much risk.
Although one portfolio or fund can enjoy higher returns than its peers, it is only a good investment if those higher returns do not come with an excess of additional risk. The greater a portfolio's Sharpe ratio, the better its risk-adjusted performance. A negative Sharpe ratio indicates that a risk-less asset would perform better than the security being analyzed.
Criticisms and Alternatives
The Sharpe ratio uses the standard deviation of returns in the denominator as its proxy of total portfolio risk, which assumes that returns are normally distributed. Evidence has shown that returns on financial assets tend to deviate from a normal distribution and may make interpretations of the Sharpe ratio misleading.
A variation of the Sharpe ratio is the Sortino ratio, which removes the effects of upward price movements on standard deviation to measure only return against downward price volatility and uses the semivariance in the denominator. The Treynor ratio uses systematic risk or beta (β) instead of standard deviation as the risk measure in the denominator.
Conclutions of the Sharpe Ratio
1)Sharpe Ratio measures the excess return per unit of risk.
2)Higher Sharpe Ratios are desirable.
3)Diversification is a key aspect to achieve Higher Ratios
4)Sharpe Ratios do not work well under assets with non-linear returns (options) or Skewed Distributions.
- Sharpe Ratio is a key aspect in Modern Portfolio Theory
Excellent post! Do you actually make a calculation of the sharp ratio for your portfolio in practice and if so how often?
I have a service called TradeStops that you hook up to your portfolios to. It then allows you to turn on different trade stops. He calculates a dynamic trade stop, by determining what he calls a volatility quotient. He essentially calculates the expected range a stock should be in and if it's drops below the lower limit, we get an email telling us it's stopped out and we should sell the position. Dr. Smith has a PhD in math specializing in systems science, statistics and time cycles. He shows each week a clever use for his website. One such use is to create a portfolio based on following the top 10 hedge fund managers and he includes Warren Buffet. It looks at their top 10 position and their performance. If they applied his dynamic stops to their portfolios, their returns are dramatically improved.
He also has a tool to look at your complete volatility quotient of your entire portfolio and then provides a single selection to show you how to balance your portfolio to have equal risk. If there is a low volatile stock, you have a have a larger position and a high volatility you would have a smaller size. This way your portfolio has equal risk. If you couple this with his dynamic stops, the billionaire portfolios are beat by hundreds of percent. It's quite incredible. Here is one example.
He uses a green, yellow and red trend line to indicate the state of the stock. If its green, you stay in the stock. Yellow means the stock has dropped to halfway to its stop limit (the red trend line). This allows you stay in your stocks longer and only exist when the volatility is outside the normal range. You can see how Einhorn would have been stopped out in 2009 and the massive outperformance this would have had using the exact same stocks he had it in his portfolio.
Great and valuable comment. I'll take a look!
What surprises me the most is that TOP 10 managers barely beat SPX return in that graph!
Certainly calculating volatility is very important to have a real stop loss. However as every statistic measure, they tend to offer false signals and situations like that yet they worth the most of the attention since preserving capital is the most important thing for all investors.
I'm currently working on a trading bot that uses Parabolic SAR as stop loss indicator.
If you can develop a trading bot, then you have some pretty substantial talent. I'm an engineer, but no way could I create a trading bot, unless I did it through a bot service that provides RPA (robotic process automation). I'm involved in a project at work where we are looking at this service to automate mundane tasks to free people to do more important things with their time...
Creating a trading bot certainly takes some time for all the backtesting needed. But is not that hard since is build in Phyton. I'm quite sure you as an engineer would have no problem in developing one.
Also, technical indicators are open source or easy to implement such as volume, macd, moving averages... the relevant fact is which indicators and which rules the bot has.
Also I thought about creating a bot for Steemit, also in Phyton, similar to those found at steembottracker.com. It's quite profitable since you receive SBD or Steem per vote yet the vote you give cost you nothing (Voting Power regenerates at a rate of 20% daily) however, around 10k SP are needed and I'm not even close yet.
Some people say it's unethical to use bots in steemit yet I think they can provide a very useful tool to promote quality content if some measures are implemented (max voting per user/day, white lists... per example) because with the current system is almost impossible for minnows to get an audience.
People are what make steemit and their are two types in the world. Those who want to add to it and those intent on taking from it. The issue I have with bots is that they lower the value of interaction on the platform. And those intent on taking have taken a big toll with high level escalation of down voting. They use bot's to make a lot of money and then down vote others who make a lot for the work they are actually putting into their posts. The biggest down voters don't follow anyone. They just self vote and run bot farms. So I've stayed away from this. I do agree that those intent on giving can effectively use a bot on steemit to be seen and I don't have an issue with that.
Wise words my friend.
Ending the bots would certainly push the quality of the platform's content and will end up with the farming.
However, why would the people who profit the most from the bots (mostly the devs from steemit and very early adopters of steemit) end them? Is hard to believe.
I think Steemit is a great platform but there are several changes needed, specially transparency.
It's like asking a drug addict to get rid of people who supply them with drugs. It's not gonna happen:)
To listen to the audio version of this article click on the play image.

Brought to you by @tts. If you find it useful please consider upvote this reply.