CHART ART: STEEM BLOODBATH
GOOD EVENING STEEMIT!
I’m back with a second CHART ART blog for the night, this time a little bit closer to home for us on this particular platform. That’s right, let’s take a look at STEEM/BTC.
On second thoughts, maybe I should just wrap up this post right here. I would probably get more upvotes than I’m going to get after you take a look at the chart I’m about to post.
Are you nervous?
Well you should be...
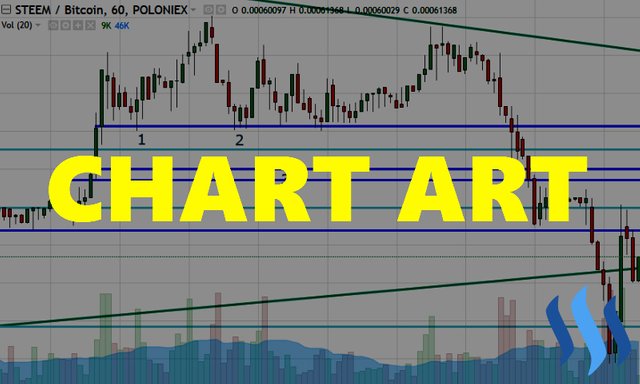
Chart Art
I want you to be ready when you scroll down to this chart, so I'm going to put in a page worth of breakers...
...
...
...
...
...
...
...
...
Are you ready?...
...
...
...
...
...
...
Don't say I didn't warn you...
...
...
...
...
...
...
Okay, you asked for it…
STEEM/BTC
Daily:
SO MUCH FUCKING BLOOD!!

SO MUCH FUCKING BLOOOOOOOOD!!
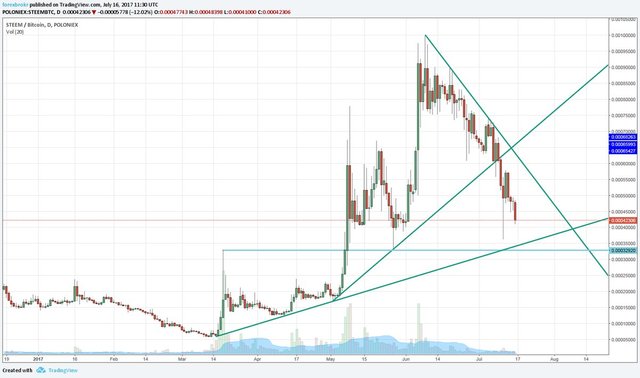
The daily chart is all that really matters in this one as the damage compared to BTC/USD has been compounded here due STEEM’s status as an alt.
But hey, if however, you do actually believe in the potential of STEEM, this area certainly offers value for buyers. Plenty of previous resistance to potentially turn to support, headlined by that 32 cent line that’s already been spiked to from both directions.
Is it catching a falling knife though? On my last BTC/USD CHART ART blog, I asked whether you’ll be able to help yourself buying at these levels. Once again, please leave a comment and let me know what you see.
Active @forexbrokr CHART ART Blogs
CHART ART: USD/JPY Double Top Pattern Continued
CHART ART: BTC/USD Intraday Double Bottom
CHART ART: BITCOIN FALLS TO UNDER $2,000!
Instagram: @forexbrokr
Website: www.forexbrokr.com
So much blood ;-(
Hahaha mate, don't say I didn't warn you! ;)
https://uk.tradingview.com/x/spEOTuus/
Note the large sell off before the marked A point. We can see clear support form along the solid red line, and the fact that buyers took it to new highs is proof that buyers were much stronger than the sellers at this point in time.
At B, we can see price finds support along the median line as can be expected according to Dr Alan Andrews research. This coincides really nicely with where we know for a fact buyers were strong before at A.
C is an interesting level, due to it’s close proximity to current price action it’s something I’d be interested in hiding a stop behind.
D is the last minor swing high. If price were to break this level, that would be evidence that buyers were once again stronger than the sellers and a possible trend reversal could be happening.
If price breaks through the support here then I'd be expecting it to carry down to the lower median line parallel.
My 2cents.
Excellent, thank you for this!
I find those Andrews' Pitchforks to be a bit subjective, but those two red lines are clear as day to anyone that's looking. Buyers are going to lap it up down there!
There's no one way to trade. If what you do works for you keep at it and stay focused. =D
Have you done the action reaction course though? I see a massive amount of fork use on the internet that frankly... is just incorrect/not how the tool was developed to be used.
I'd argue that trading is entirely subjective. ;)
Buyers for sure going to lap it up down here. Can already see them starting with that recent wick. Question is where are the sellers?