CHART ART: BITCOIN FALLS TO UNDER $2,000!
GOOD EVENING STEEMIT!
Well hasn’t a lot happened since my last BTC/USD CHART ART blog! It’s just unfortunately that not too much of it has been positive if you're long crypto…
All of this SegWit2x bullshit continues to erode confidence in cryptos and the market is just pricing in the risk surrounding what could happen come August 1. I've talked about my opinion on this in one of my previous blogs that I linked to just there, so head over there and add your two cents if you'd like to contribute.
Just at the moment, I find it pretty ironic that the guys arguing against the proposed changes on the premise that it gives too much control to a select few, are essentially holding Bitcoin to ransom and doing the exact thing they are trying to prevent possibly happening by someone else in the future.
Petty fucking children. Come on, let’s just stabalise this thing and get on with it!
Chart Art
In terms of charts in the crypto trading space, the only one that matters right now is Bitcoin. The price of all other crypto markets just live and die by what happens in Bitcoin and so long as it’s shedding blood, so will everything else.
And fuck me, there is a lot blood…
BTC/USD
Eurghh it just makes you feel sick looking at this daily chart.
Daily:
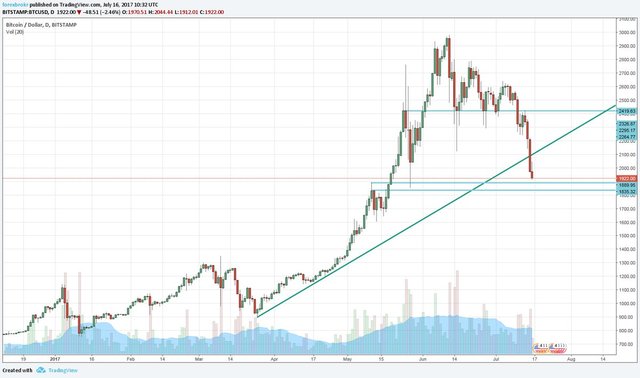
Good night daily bullish trend line support and good night $2,000 psychological level.
We certainly can no longer say:
“Oh, but the daily trend lines are all still in tact so it’s technically still bullish”
YUCK!
One thing I did want to point out however, is that even in the midst of a crypto bloodbath, price STILL behaves in a highly technical manner.
Check out the intraday price action as price broke the daily trend line support level that EVERYONE in the crypto trading planet had their eyes on.
Hourly:
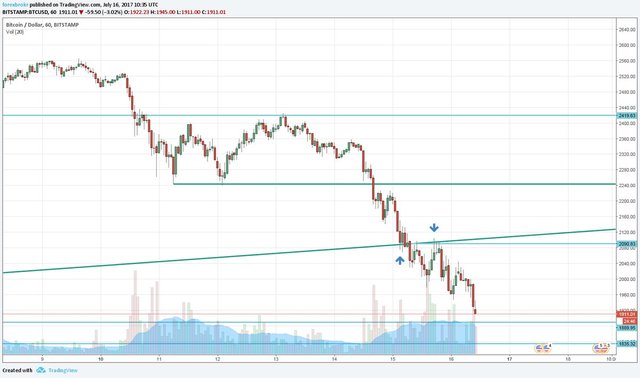
Price breaks out of the trend line lower, but perfectly retests the previous support level as resistance before properly dropping lower. Not to mention that this was also a retest of short term support that turned to resistance on the hourly too.
Even in downward spirals, markets ALWAYS retain their technical, predicable price action. You can’t help but love it.
Anyway, go back up to the daily and I've marked the next obvious support zone that price is going to look to test before deciding where to head next. All I can say is this probably isn't the smartest time to be catching a falling knife.
...but can you help yourself? Leave a comment and let me know why you see this as either a buying opportunity or one to let slide through to the keeper.
Active @forexbrokr CHART ART Blogs
CHART ART: CHART ART: USD/JPY Double Top Pattern Continued
CHART ART: CHART ART: BTC/USD Intraday Double Bottom
Instagram: @forexbrokr
Website: www.forexbrokr.com
We are in agreement here, I have posted similar opinion ysterday..
https://steemit.com/btcusd/@shashikumar/here-goes-btc-below-2k
So you can't? :P
Also thanks for sharing your analysis post. I like that trend line that is being retested. I have added that to my charts.