Steemit Power Relationships between Groups - Conclusion
This post is a continuation of my article last week on Steemit Power relationships between groups. In the comments section, @theleapingkoala requested for a graph that shows the data visually. It was on my bucket list for some time as I was looking at some other stuff. Today, since there is not much to post on steemit, I thought I could fulfill the curator scientist's request.
Tools Used:
The blockchain data comes from the reliable steemsql.com by @arcange.
The data required for the analysis has been pulled on to the Google Sheets which is a an excellent online alternative to MS Excel.
The Method:
A glossary of the terms that are being used in the charts:
| Vesting Balance | Category |
|---|---|
| Above 1000 MVests | Whale |
| Above 100 MVests | Orca |
| Above 10 MVests | Dolphin |
| Above 1 MVest | Minnow |
| Below 1 MVest | Plankton |
What is a vest? See here.
The Charts
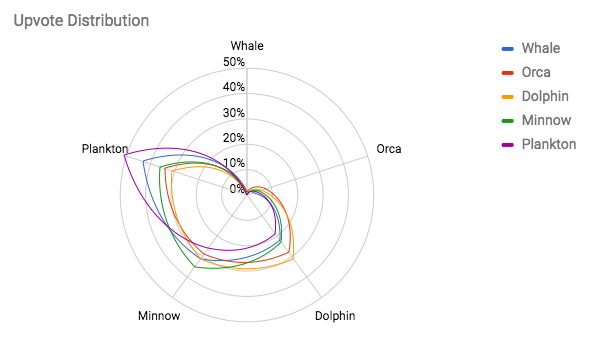
Upvotes

The radar chart resembles a ?; so upvote is indeed the heart of the Steemit ecosystem!
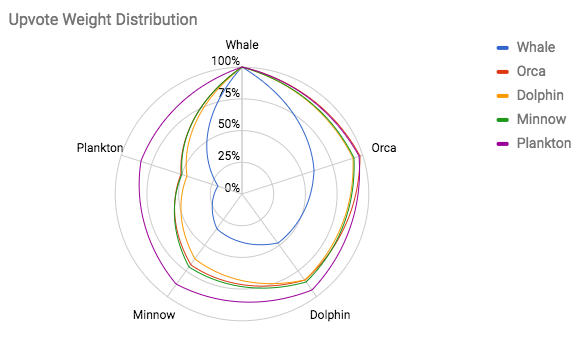
Here is the radar chart showing the spread of voting weight among the different categories:

Downvotes
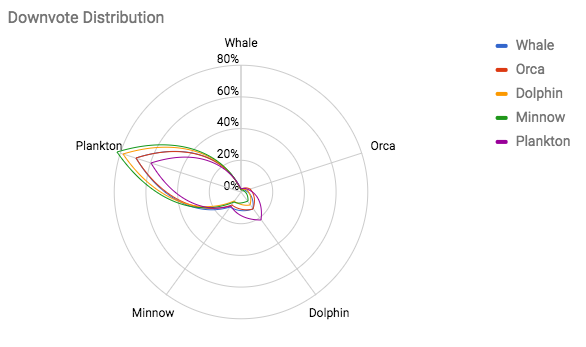
Another radar chart, this time showing the downvotes which contribute to around 1% of the total votes in Steemit.

Notice the shape of the downvotes, got anything?
I am calling it the Downvote tadpole!
Let us hope that it does not grow up to become a big ? courtesy - bad content and bad blood.
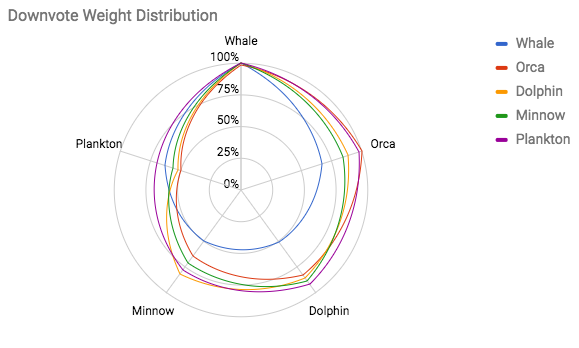
The final radar chart that shows how the voting weight is spread in those downvotes:

I thought of updating the orignal article with these charts, but then those who have read it may not revisit it again as it will not come into their feed again. So this post becomes the final part of the Voting Power relationship between different groups on Steemit.
If you find this article interesting, check out my post on Average Votes per Day by User Category to find out if users are hitting the 20 votes/day mark suggested in https://steem.io/getinvolved/paid-to-curate/
I am a part of the Steemit Business Intelligence community. We all post under the tag #BIsteemit. If you have an analysis you would like carried out on Steemit data, please do contact me or any of the #bisteemit team and we will do our best to help you...
Join the fabulous Steemit Blogger Discord community:
https://discord.gg/e5XFZKa
...and do not forget to

Cheers,
dbdecoy


Very impressive work @dbdecoy,
Thanks for sharing the informative charts :D
Congratulations bro. Upvoted and re-steemed.
Thank you!
The radar charts are an interesting chose of visualization.. The downvotes does look like a tadpole
Great stuff!
I like this chart:

Notice how the distribution rises as we go down the ranks. Lots plankton and lots of votes!
This chart seems to show its smaller members that are lowering the weight of their votes?
Thanks for sharing!
This post received a 2.11% upvote from @randowhale thanks to @dbdecoy! To learn more, check out @randowhale 101 - Everything You Need to Know!