STEEM Long Term Price Analysis Using More Than Two Years Data – monthly update
Every Steemian what to know what the price of STEEM in the future will be. We all here “work” and get rewards for our time and effort in STEEM. Some have also made heavy investment in STEEM. It is very understandable to want to know what the prices of STEEM in the future will be. Will it all go done and worth nothing, or it will be propelled up and we all become reach.
This days STEEM and all the crypto market is down again, and a lot of people are worried.
Speculating on the crypto market has become a profitable business for some people.
This post is not about that.
I don’t believe in short term analysis and get rich quick schemes. Even if some people achieve to get rich in a quick way, at the end they will lose it fast as well. Easy comes, easy goes.
There is a lot of analysis, TA on the price on STEEM, and every other crypto, focusing on day to day price. But let’s take a look at the bigger picture here. I’m doing this long-term price analysis, so I can manage expectations and not get distracted by these everyday speculations. I'm using all the data for the daily prices, since STEEM was launched. Then I’m updating it every month with the last month data, to see how that month impacted the long term trend.
Predicting the price is like predicting the future. And for sure nobody knows the future. But then yet again this is predicting, it means we are trying to guess the price, not accurately to know it.
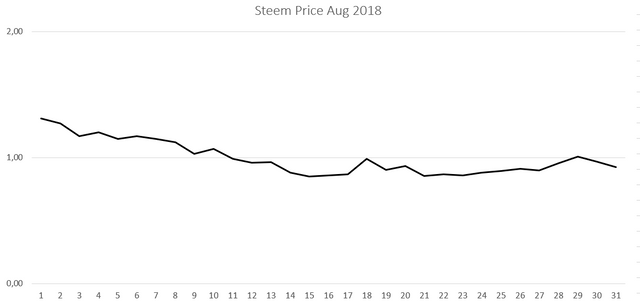
First let see how the last month went. Here is the graph of the STEEM price in august 2018.
screenshot taken from my excel file
Steem entered the previous month with value of around 1,3$ following the down trend from the previous month. Somewhere in the middle of the month it reached a value of 0,85. The lowest for the year. This days we are seeing another low, but for that one more in the next month analysis.
At the end of the month the price recovered a bit and just for a short time it reached a value of 1$.
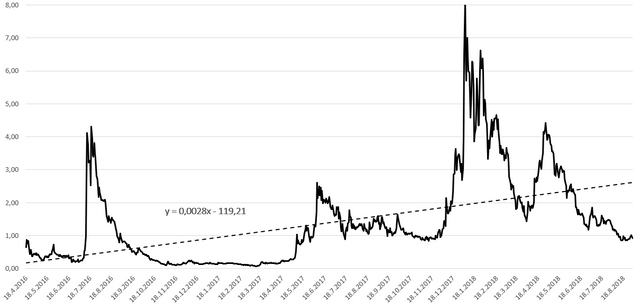
Now let’s add this data to the historical data on daily steem price from 18 April 2016 till now.
The source data for this is coinmarketcap.com
This been sad let’s take a look of the analysis.
After importing the data, chart is formed from it.
screenshot taken from my excel file
The chart above is a function of the price of steem in time. When showing the relationship between one variable in correlation with one other variable, it is called simple linear regression. If more than one factor is included the process is called multiple linear regression.
As mentioned this is a data for something over 2 years. Not bad for a decent analyst, but I prefer a 5 years data. It is a nice base for clear trend and with data not that old to lose the trend from the last period. But still not a short period for the analysis to be not relevant.
Next the linear trendline is added and the formula is extracted. Here it is.
y = 0,0028x - 119,21
where:
y – price of steem
x – the date for which the price is calculated
In this format, the date is presented like a numeric value.
Having extracted the formula, we can now input a day in the future and predict the price of STEEM.
The price of STEEM 01.01.2019?
To answer the question, we need to input the date in numeric excel value in the formula above. The date is 01.01.2019, and the number for this date 43466.
price = y = 0,0028*43466– 119,21= 2,49
The price of STEEM in august 2019, using this method will be 2,49
I hope this goes without saying but just to be clear.
I do not provide personal investment advice and I am not a qualified licensed investment advisor.
It is representation of a very simple statistical model to predict the price. This can be totally inaccurate, and the price can be very different from what it’s shows here. Events can occur that can change the price quite a lot.
In fact, if you look at the past period, the trendline is very different from the actual price.
Having said this lets now play with the formula and make some wild predictions for the next five years.
| No | Date | Price |
|---|---|---|
| 1 | 01.01.2019 | 2,49 |
| 2 | 01.01.2020 | 3,52 |
| 3 | 01.01.2021 | 4,54 |
| 4 | 01.01.2022 | 5,56 |
| 5 | 01.01.2023 | 6,59 |
From the table it can be concluded that the price of STEEM should increase in time, at a steady rate year after year. The trend is still bullish long-term. In five years, the price should be six times the ones that it is now.
But this is just statistics. It shows averages, not exact numbers. The exact price is simply impossible to predict. Milionis of factors can appear, and millions of scenarios are possible.
One of the values that represent the accuracy of the model is R-Squared (Coefficient of determination)
Here what Wikipedia has to say about this:
In statistics, the coefficient of determination, "R squared", is the proportion of the variance in the dependent variable that is predictable from the independent variable(s).
It is a statistic used in the context of statistical models whose main purpose is either the prediction of future outcomes or the testing of hypotheses, on the basis of other related information. It provides a measure of how well observed outcomes are replicated by the model, based on the proportion of total variation of outcomes explained by the model.
In the model above the R Squared value is 0,27. Meaning that the time as variable have 27% impact of the final output, the STEEM price in our case. This is not surprising having in mind that STEEM is around for a short period, from statistical point of view. And in this period the price has been massive unstable.
To improve the probability of the model we will include one more variable.
Let’s put the Bitcoin price in the model
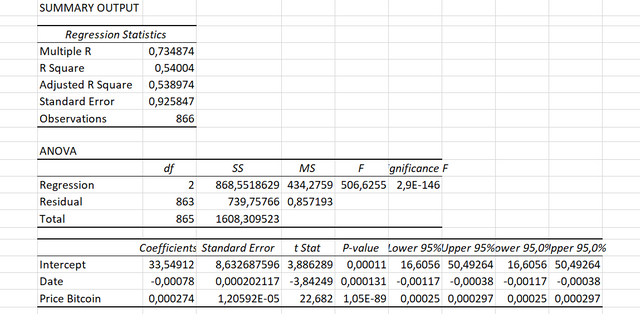
Now except for time, what other variable impact the price of STEEM a lot. Well of course Bitcoin. When taking into account these two factors, time and the price of Bitcoin we have something that is called a multilinear regression. I want go I to much details and explaining how it work. It is done in Excel, with the help of Data Analysis tool pack, regression. This analysis is a little bit more complicated with more outputs data. When run, the output looks like this.

screenshot taken from my excel file
And this is just a part of it 😊
One of the important things here is that the value of R Square is 0,54. Meaning that these two variables have 54% impact of the final output, the STEEM price in our case. Remember with just the time as a variable the value of R Square was 0,27. So we have improvement of the accuracy here.
We can extract a formula from here and use it for a future prediction.
It goes like this:
STEEM = 0,000274X - 0,00078Y + 33,54912
where:
X – the date for which the price is calculated
Y – Bitcoin value
I have made Bitcoin price analysis with a five years base, and R Squared value od around 0,5. I will use that predictions for the model above.
When the data is entered in the formula this is what we get, for the next five years.
| No | Date | BTC Value | STEEM Value |
|---|---|---|---|
| 1 | 01.1.2019 | 6.942 | 1,69 |
| 2 | 01.1.2020 | 8.599 | 1,86 |
| 3 | 01.1.2021 | 10.260 | 2,03 |
| 4 | 01.1.2022 | 11.917 | 2,20 |
| 5 | 01.1.2023 | 13.574 | 2,37 |
Now it is clear that the trend has dropped a lot, from the analysis with just the time as variable. The price is still increasing but slowly. Not the insane bull run that everyone is wishing for.
But If anybody is serious about anything in life it takes time. This is the case for STEEM and crypto as well.
Slow and steady is the best way forward.
At the end once again :)
I do not provide personal investment advice and I am not a qualified licensed investment advisor.
This is a representation of a simple statistical model. Statistics is about trend and averages, not a an accurate predictions.
All the best
@dalz
Previous posts on this topic:
- Bitcoin long term price analysis September 2018
- Steem long term price analysis August 2018
- Bitcoin long term price analysis August 2018


Thank you for this! I hope to see the price skyrocket again hehe :) I’m here for the long term for sure
Posted using Partiko iOS
Thanks for the comment :) I hope it will skyrocket as well.
Posted using Partiko Android
Congratulations @dalz! You have completed the following achievement on the Steem blockchain and have been rewarded with new badge(s) :
Click on the badge to view your Board of Honor.
If you no longer want to receive notifications, reply to this comment with the word
STOPDo not miss the last post from @steemitboard: