Bitcoin Long Term Price Analysis Using Five Years Data – monthly update
Bitcoin is showing a sign of recovery in the last couple of weeks. After a long period of downwards trend it is getting up slowly. But what this means to the long-term perspectives of it?

scource
Bitcoin is the most important crypto of all. It shows the trend of the entire crypto industry. Having sense where the price of Bitcoin is going is showing the trend for all the coins. Including STEEM.
Here I’m making a long-term analysis of the price of the bitcoin. I’m using a five years data from coinmarketcap about the price of the bitcoin. Daily data is pulled of and a long-term analysis is made. Five years data is excellent base for analysis.
The crypto market is still in early stage and with a lot of fluctuations. It is massively unstable and very speculative.
There is a lot of analysis on the price on bitcoin and every other crypto, focusing on day to day price. But let’s take a look at the bigger picture here. I’m doing this long-term price analysis so I can manage expectations and not get distracted by these everyday speculations.
If anybody is serious about anything in life it takes time. This is the case for Bitcoin and crypto as well.
Speculating on the crypto market has become a profitable business for a lot of people. This post is not about that. I don’t believe in short term analysis and get rich quick. Even if some people archive to get rich in a quick way, at the end they will lose it fast as well. Easy comes, easy goes.
I’m doing this long term price analysis with five years data, and updating it on monthly level.
This been sad let’s take a look of the analysis.
The period from which the data is taken is from 01.09.2013 to 01.09.2018.
After importing the data, chart is formed from it.
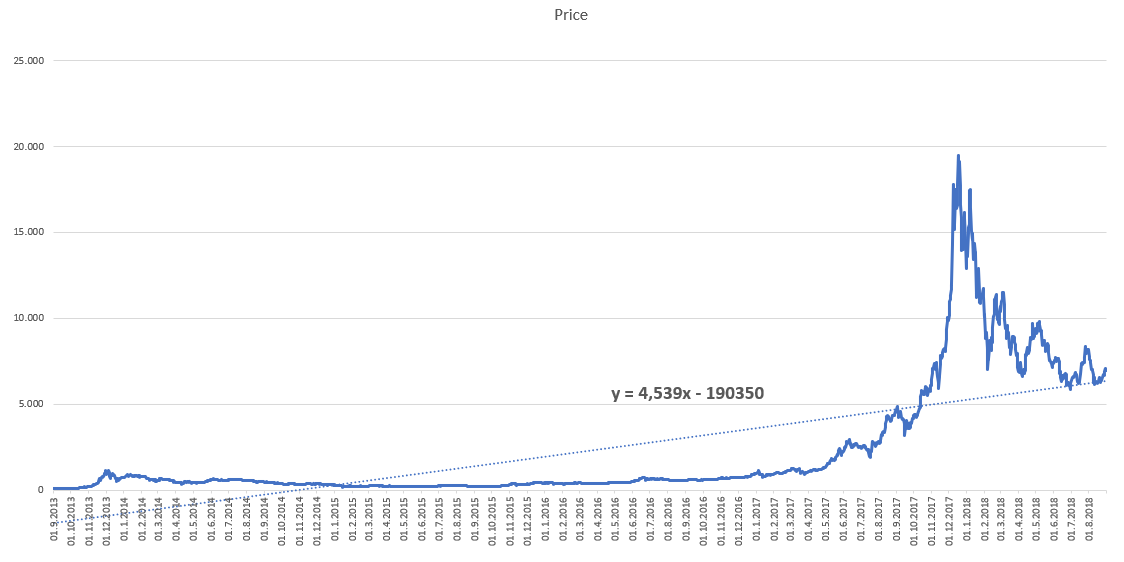
screenshot taken from my excel file
The chart above is a function of the price of bitcoin in time. When showing the relationship between one item in correlation with one other factor, this is called simple linear regression. If more than one factor is included the process is called multiple linear regression.
As we can noticed the trend line has a small steep now, meaning that the price from now one will increase slowly.
Next the linear trendline is added and the formula is extracted. Here it is.
y = 4,539x + 190350
where:
y – price of bitcoin
x – the date for which the price is calculated
In this format, the date is presented like a numeric value.
Having extracted the formula, we can now input a day in the future and predict the price of bitcoin.
The price of bitcoin in September 2019?
To answer the question, we need to input the date in numeric excel value in the formula above. The date is 01.09.2019, and the number for this date 43709.
price = y = 4,539*43709 + 190350= 8.045
The price of bitcoin in august 2019, using this method will be 8.045
I hope this goes without saying but just to be clear.
I do not provide personal investment advice and I am not a qualified licensed investment advisor.
It is representation of a very simple statistical method to predict the price. This can be totally inaccurate, and the price can be very different from what it’s shows here. Events can occur that can change the price quite a lot.
In fact, if you look at the past period, the trendline is very different from the actual price.
Having said this lets now play with the formula and make some wild predictions for the next five years.
| No | Date | Price |
|---|---|---|
| 1 | 01.01.2019 | 6.942 |
| 2 | 01.01.2020 | 8.599 |
| 3 | 01.01.2021 | 10.260 |
| 4 | 01.01.2022 | 11.917 |
| 5 | 01.01.2023 | 13.574 |
| 6 | 01.01.2024 | 15.230 |
| 7 | 01.01.2025 | 16.892 |
| 8 | 01.01.2026 | 18.548 |
| 9 | 01.01.2027 | 20.205 |
| 10 | 01.01.2028 | 21.862 |
From the table it can be concluded that the price of bitcoin should increase in time, but slowly. Not the insane bull run with bitcoin worth of one million.
But this is just statistics. It shows averages, not exact numbers. The probability for this numbers is bigger in the first 2 -3 years. After that it is simply impossible to predict anything. Milionis of factors can appear, and millions of scenarios are possible. And even for the first couple of years, it is just more probable, not sure.
Comparing this month with the previous month, for which I also made this type of analysis the trend is showing a light inverse. The previous month the data showed that for 01.01.2019 a price of 6.824. Now it is 6.942. So august has lift the trend for just a bit.
All the best.
@dalz