09 September 2016 - Honest and explained technical analysis STEEM / BTC / USD by najoh
Last month analysis
Last month I predicted that the price of STEEM would go down to 0.57 on this post : https://steemit.com/steem/@najoh/steem-technical-analysis-support-broken-new-lows
We are almost there, my new prediction based on my analysis and experience of the markets is that we might see lower prices than I expected. The next support is at 0.20 and we are headed to that level very soon. We might even see single digits cents before the end of the year. I wouldn't be surprised to see the price of STEEM between 1 to 3 cents before December.
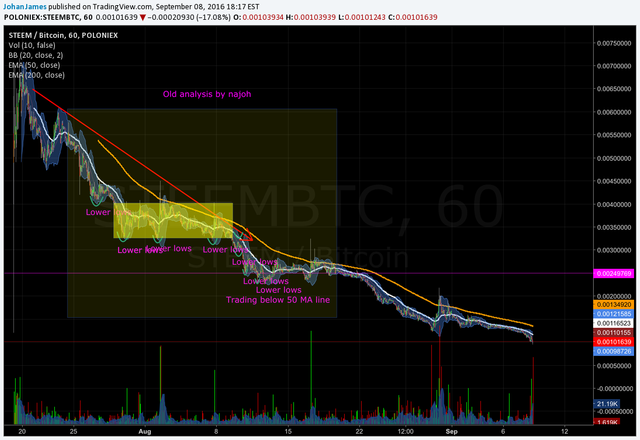
This month analysis on hourly chart
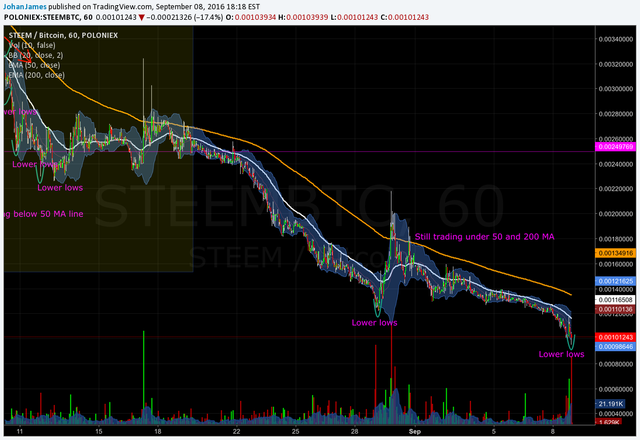
Lower lows and still trading under 50 and 200 MA. Very bearish.
This month analysis by day
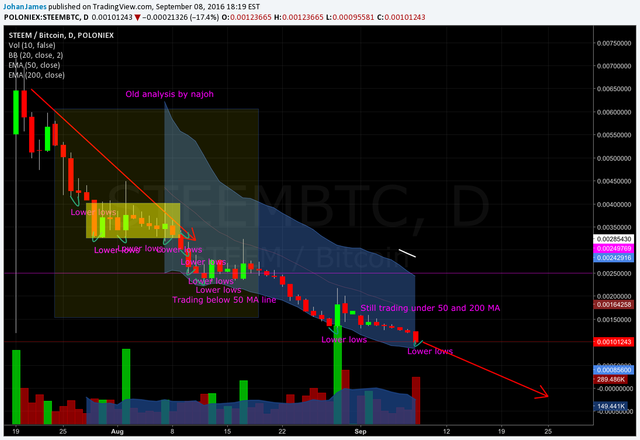
I think the chart speaks for itself. Very bearish.
HELP on how to understand the charts
Under this line I explain how to understand the charts, I will use this information from now on to help you guys to understand better how this whole thing works.
What is the 50 MA and 200 MA and why does it matter ?
Link : http://www.investopedia.com/terms/m/movingaverage.asp
When the price is trading under the 50 MA is a bearish sign, meaning that the price should be moving lower in the future. The same goes for the 200 MA, but the 200 MA is a longer term trend, trading under the 200 MA is very bearish.
Where are we now ? We are trading under the 50 MA and 200 MA. Bearish.
Bullish reversal, how to see it
You may want to know when the price is going to reverse, first of all the price should move over the 50 MA, then the 200 MA, once it's there, the 50 MA line should cross over the 200 MA line, if this doesn't happen, it's a bearish sign, if this does happen, it's a bullish sign.
If you see the white line (50 MA) crossing over the orange line (200 MA), this will mean that the price of STEEM is going to go much higher and that the longer trend reversed from bearish to bullish.
Actually the white line (50 MA) is trading under the orange line (200 MA), this is a very bearish sign, meaning the price is most likely to go down. On the chart you can see that sometimes the price go over the orange line (200 MA), you may think that it's a bullish sign, but it's not. It's what we call a dead cat bounce* and it's a good point to sell off your STEEM if you still have any.
Dead cat bounce
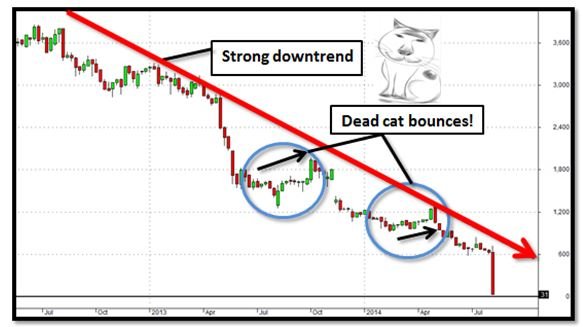
A dead cat bounce is when the price rebounds after a fall and then falls back again. This is what happened on the STEEM chart when the price moved over the 200 MA for one hour.
Lower lows, what it is

Lower lows indicate that the trend is bearish and prices going down more and more, until a higher low happen, we can expect the prices to go down. If you look at the chart, we have only lower lows, meaning the odds of the price going higher are very unlikely. Once we start seeing higher lows, the trend could reverse.
Support and resistance points

The support is where the price in the past encountered a lot of buyers and where the price couldn't go lower. If a support is broken, we look for the next support and so on. Breaking a support one after another is a very bearish sign.
The resistance is where the price in the past encountered a lot of sellers and where the price couldn't go higher. If a resistance is broken the price might go much higher in the near future, it's a very bullish sign.
Parabolic move

When the price rise higher very fast this creates a parabolic move, when this happens almost always the price falls back to where it was before the move occured. You should sell at the top of the parabolic move and wait for the price to cool down.
Triple bottom

Normally a triple bottom is a bullish sign. In our chart our triple bottom went down instead of going up. This is very bearish. When that happen the price will trade much lower, it's exactly what happened.
Did you predict the rise to $4-$5? Did anyone? This is very interesting analysis, but my problem with predicting (what I consider to be unpredictable) markets via analyzing history creates a false sense of confidence and possibly even a self-fulfilling prophecy. It's possible some aspects of human psychology repeats itself when it comes to bear/bull markets, but I'm not convinced this has much "science" to it other than just drawing lines and creating stories that fit those lines.
What if Facebook/Twitter have a major censorship scandal? What if a bunch of major news stations do stories on Steemit and drive demand like we haven't seen yet?
My point is, how can we really know? You may be right and the price may continue to decline as people lose interest in Steemit and it fails to gain new users. On the other hand, all new campaigns could start up to bring in new users who want to purchase influence via buying Steem Power.
How can we really know?
Let's all remember that by holding SP you are getting a near 300% stock split this year, so the price would have to fall from $1 to .30 cents and you'd still break even. The more SP you have the more Steem you get for holding. In a few months the price could be back at $2 and SP holders would have tripled money from here. The question we should be asking ourselves in two years from now where will the value of Steem be? If it catches mainstream at people will have 20-50x returns much like Bitcoin did and Ethereum. Steem still is in very early stages so let's see what's going to happen.
The price falls much faster than the interest of SP at the moment. So for now it's better to wait.
The thing to look at is the market cap, if it's going down then it's better to wait for a more favorable moment to invest.
True but nobody knows where 'bottom' is. You can wait for an uptrend to develop while I we be constantly adding more and more Steem Power, collecting more and more of Steem tokens. We could trade sideways for a while and SP holders will gain. Price has to fall a lot more to be negative returns in 2 years.
Steem still in Beta. 3 months is nothing. Go look at Ethereum price pump and dump last August after the tokens hit the exchanges (fell by 4 times), only by Jan. the price went parabolic less than a year later. Steem is probably going to do something similar.
It's all explained in the post, if a bullish reversal happens you can see it right away.
You can't predict to where exactly it's going but you can predict in which direction is going, so go long when it's going up and go short when it's going down.
Yes I could predict the parabolic move, and anyone could. You can't predict where is the top, but you can see that a parabolic move is happening. And with every parabolic move comes a sharp down movement in which we are still are.
I read that as, "If something happens..." (meaning it's now in the past) "...I'll be able to explain it with my charts." Since it can literally go any direction, there's always some explanation or some line drawing or hourly, vs. daily vs. whatever that would "make sense" of it, right?
For me, it's not "predicting" the direction it's going as much as it's looking at the past activity and saying, "Yep, it's going down and it's doing so at this velocity." That lends itself to the idea of "Even those who are committed to this thing are selling at this velocity in hopes of buying up even more later at a cheaper price." Same thing could be said the other direction. Even those who could care less will buy when the velocity up is high enough that they can get out before the last sucker does.
But to me that's just looking at the past. That's not a prediction as much as it's stating the obvious. People were talking all kinds of "flag pattern" this and that when STEEM hit its highs and didn't crash back down right away. Now that a little more time has passed, and we have more data in the past to look at "predictions" via charts seem more "accurate" but to me they aren't predictions as much as they are reading of historical data and making educated guesses as to whether the trends will continue given the velocity of the trend and other factors such as user adoption, publicity, etc.
I'm not saying these charts aren't useful for tracking trends as they happen or that there aren't patterns which tend to emerge within otherwise chaotic systems (such as the "dead cat bounce"). I do think some are better at intuitively deciding when to get in and out than others and charts seem to be a good story to tell to try and make sense of that intuition. That's my thought, anyway. Just as no one can explain why caused Steem to shoot up to $4-$5 the first time, I doubt anyone could actually predict if it would do that again tomorrow, or next year, or never.
You are thinking too much, it's bad for trading. Once a parabolic moves start no ones knows where it will stop and when, but a parabolic moves always stop and revert back.
Now steem is going down, that's a no brainer here. Some dead cat bounces may occur along the way. Unless some new factor enters in the game (big investor, big news, buying pressure), the price will fall.
And the last parabolic move was easy to see and I predicted when it was going up that the price would go back down. I told my friends to not buy steem and they didn't listen, they bought at 4 USD, and now they are crying that they didn't listen.
By the way if you look at my TK post here, I made 10 000 USD in 6 days on that trade (profit already booked) : https://steemit.com/trading/@najoh/12-august-2016-technical-analysis-nyse-tk
Congrats! If every trader could do that every time, it would be free money all around. :)
That's not possible unless the market only go up forever.
If steem drops to single digits do you think steemit will still be able to gain popularity?
It gained popularity when it was non-existent at value 0, so everything is possible.
Interesting post.
Also, are you still doing your Urban Photo Contest?
I had entered a while ago and hadn't heard anything yet.
Problem is, no rewards to dispatch as the contest didn't gain popularity.
Yeah, but you only tried once.
How many people entered?
I would suggest at least doing the winners post with no pay out for that one, but using it to gain popularity for a future contest and maybe put the payout from the winners post towards the next contest. It was a good idea, and may catch on if you give it another try.
They now have contest chat on https://steemit.chat too
Either way, thanks for the encouragement to take some great photos.
back in the business !
Strange that you're earning 1 dollar for this when OZ earns hundreds for far less work and value.
He got bots whales up voting him and more followers. On steemit the most important is not the value of your post but the potential popularity. Unless a few whales notice me and up vote all my posts like ozmaster I will never make money here. That's why I stopped posting.
Yep, the whales make money easy and it's risky for small guys to upvote for unknown authors as you end up not making even a penny for it. Sorry to see you in such position.
It's fine, anyway steemit is gonna blow up with such flaws in it's design. Guys like me are not posting content because it's useless to do so. If I had 100 to 200 USD per post, I would post the best trading content ever, and not only about steem but about real trades.