12 August 2016 - Technical analysis NYSE:TK
I've been trading TK for the last year, this stock has huge moves and it's quite predictable and easy to make money. Yesterday i bought 10 000 shares at 6.30 USD, let's analyze the chart.
Daily chart

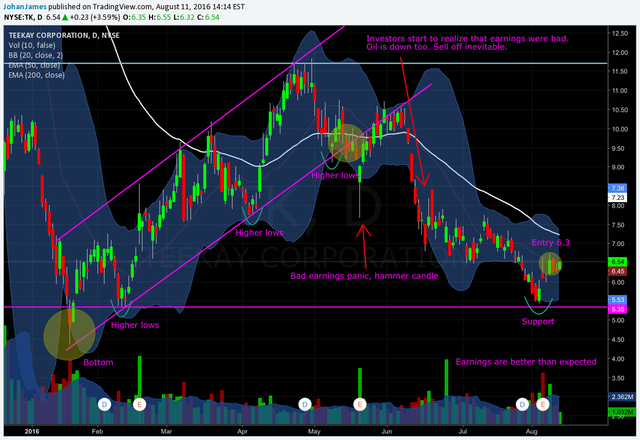
On 03 August 2016 we touched the support level of 02 February 2016. When this happened the price rebounded to 11.81
The 1st quarter earnings report was worst than what the analyst expected, the stock sold off creating a hammer candle. In the following days the price went back up in a dead cat bounce before falling like it should have done after the earnings.
The price may resume higher in the following weeks, i entered a position of 10 000 shares at 6.30
Hourly chart

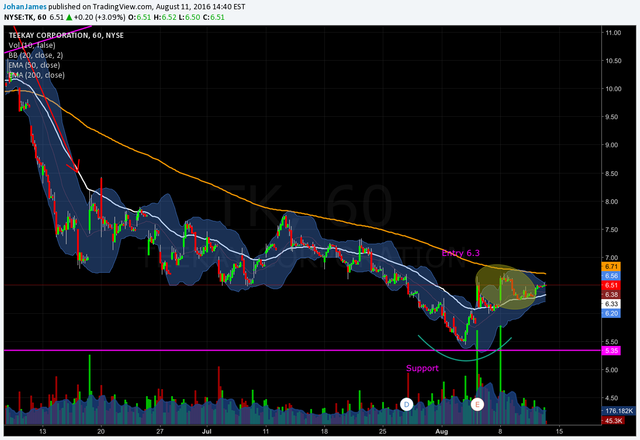
On the hourly chart we can the see that TK is trading over the 50 MA line indicating a possible bullish reversal in the following weeks. We should wait for the 50 MA line to cross over the 200 MA line for a confirmation of the trend.
The 2nd quarter earnings were better than expected, I believe that TK could be trading higher soon.
We should always be prepared, anything can happen in the market. The price could fall or rise at any time to any level.