Steem Price Technical Analysis - Support Breaks Down, New Lows and What's Next for Steem
After consolidating in a range for nearly two weeks, support finally broke and the bears succeeded in pushing price to new lows. Lets take a look and see if we can find out what's in store for Steem.
This analysis is on the STEEM/BTC pair on the 240 minute timeframe. Data provided by Poloniex and charted in TradingView.
Previous Analysis and Reflections
If you had been following my previous analysis on the STEEM/BTC pair you would know after the bullish deep crab completed we hit our first target and closed 1/2 our position. After taking profit we raised our stop loss to break even and let "the other half ride". Unfortunately, our stop loss was triggered at 0.0245 BTC and we were stopped out at break even for the remaining half of our position. Not bad, at least we took home some profit.
Although I could have exited my position earlier and banked more profit, this is not always the case. Sometimes my trade, after retracing, will breakout and hit the second target allowing for a nice return. Ideally, had I been monitoring STEEM/BTC more closely, I would have exited this trade once there was a break of the trend line.
Note to self: Pay more attention and take profit once the trend line is violated.
Where is Steem Heading?
As people see the price of Steem fall they might wonder... now that we have reached new lows where will price go? This is difficult to answer because we have no frame of reference, hence we have no idea where price will go... or do we?
This is where Fibonacci levels come into play!
Fibonacci Clusters as Support
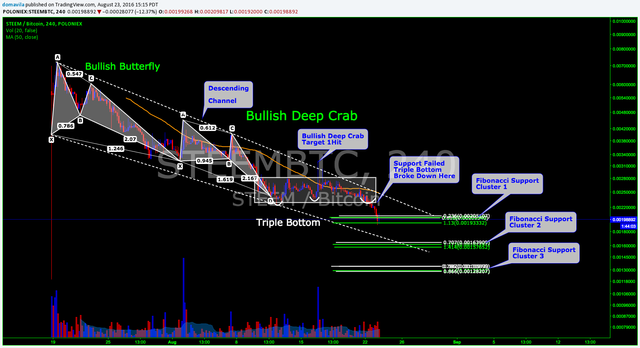
While doing my analysis I found some key levels of support backed by Fibonacci price clusters. I found these levels by drawing multiple Fibonacci retracements, extensions and projections (please see chart above), and many of them converged in similar areas. This is called Fibonacci confluence, or a Fibonacci price cluster. This method is outlined in the book "Fibonacci Trading" by Carolyn Boroden, AKA the Fibonacci Queen.
These three distinct Fibonacci clusters could serve as key areas of support or zones to go long (or possible future downside targets if you are short) . Please note, that with such little data, low volume and susceptibility to extreme volatility, TA on this new instrument is limited. With time more defined support and resistance levels will develop and this pair will become easier to trade.
The Descending Channel
Another key area to watch is the bottom of the descending channel. I will be watching this area very closely if the bears manage to push price there. This area coincides with the second Fibonacci support cluster on my chart which is another reason to keep an eye near the 0.00165 BTC level.
View Image
Case for the Bulls
As mentioned previously, Steem has been in a descending channel for quite some time and although it looks grim for the bulls there might be some light at the end of the tunnel.
Price is finding support at the first Fibonacci cluster. If the bulls can hold the price here and push it though the top of the descending channel we could see a possible breakout and a change of trend direction. If support fails we have more downside targets to look at for possible areas of support.
Please be advised, these Fibonacci clusters may provide decent spots to scale into a position but I would be cautious buying at this time because countertrend trading can be risky. One needs to be very decisive, and needs to get in and out of trades quickly to be a countertrend trader. This trading style requires one to watch the trade carefully and is usually left to the more experienced trader.
If I was a bull, it would be wise to wait for price to break out of the descending channel to get a clearer sense of direction before going long.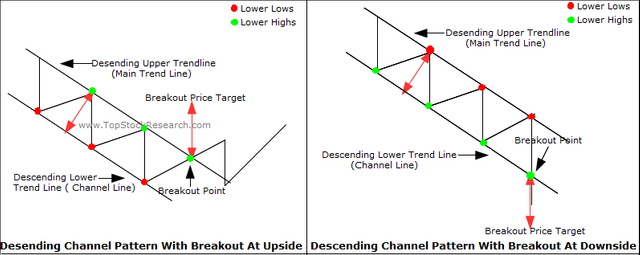
One last case for the bulls is oversold RSI.
RSI
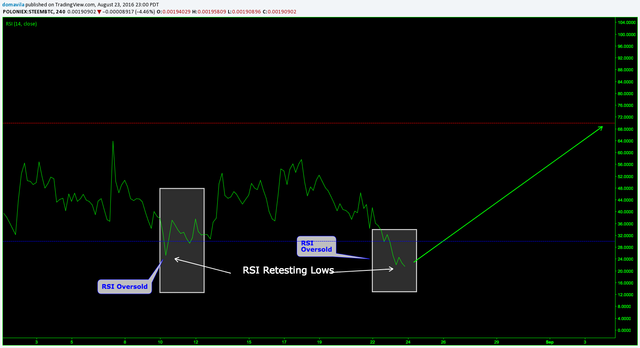
RSI is currently in extreme oversold territory and is bound to start heading north soon. Also, RSI has recently retested lows, when this occurs we often see a quick reaction to the upside.
Case for the Bears
As mentioned earlier, we have been in a downtrend for quite some time. Until price breaks out of the descending channel, it is safe to say Steem is in bear country. Steem continues to trade below the 50 MA and 200 MA while we are witnessing "lower lows and lower highs". This is very bearish and the red arrows on my chart show possible downside targets.
Conclusion
For the time being the bears have gained control of the situation and have pushed price to new lows. With the bears printing "lower lows and lower highs" we are clearly in "bear country".
Now, I will sit on the sidelines, watch price action unfold, and look for a nice entry. If support holds at this current level I will consider slowly scaling in and then wait for the breakout at the top of the descending channel for confirmation.
If price falls further to the downside I will be watching the lower Fibonacci support clusters for price action and will look to see if support holds for a possible entry.
Updates will be posted in the comments section.
UPDATE
View Image
After reaching new lows we are currently finding some short term support. RSI is beginning to turn up and we could see price follow. I might scale into a small position here but I still think it is risky.
Personally, I still have further downside targets in mind. I am looking at the bottom of the Descending channel into the Fibonacci Support Cluster 2 as a possible entry point for a long position. This also coincides with the completion of the AB=CD harmonic pattern as mentioned by @jamesbrown or the end of a measured move.
Don't forget the AB=CD harmonic pattern that completes near one of those big Fibs clusters, not to mention horizontal price support around that same level (you can't see it on Poloniex or Trading View's charts, but you can on Bittrex, which has a longer price history). That makes for a confluence of a harmonic pattern completion, at least three fibs extensions (circled in red on my chart) and the horizontal price support - at least 5 supports converging together; that I call a kill zone.
Not to get too overconfident, though. Price can certainly break all this support in a single day. You're right to point to the price channel as a good indicator of possible change of bias (bear to bull).
Thank you for a very interesting discussion with plenty of backup evidence. It will be interesting to see where the market goes from here. I suspect we might see some sentimental buying support around the $1 mark
Thanks for commenting. The $1 mark could serve as psychological and sentimental support like you said. Cryptocurrency is wild and you never know what's going to happen, it is interesting to watch this play out.
Let's don't forget about fundamental factors. Bitcoin core will be added with some new features soon and obviously the bitcoin will rise after that. Very many people expect for bitcoin rise after halving appeared. After bitcoin access its next resistant level, steem's price will change its direction. It's my personal opinion.
Great analysis I hope we find a bottom soon.
Lets see where it forms.
Well presented case. An approach I like to use once I have worked through the trade setups, is to compile a list of REASONS NOT TO TAKE THE TRADE.
These can be technical reasons like a resistance or support line (horizontal or trend) in the way; upcoming news; competing signals in opposite directions; mindset not right.
There may be value in sharing thoughts on what is happening on BTC charts. For example, with BTCCNY in a triangle hard to see Steem going long
Note: I used CNY because the chart is clean - I have scrawls all over my BTCUSD chart
I like this idea a lot. I am doing this before I make a trade. I somewhat do it when I break down "the case for the bulls and the bears" but I don't go as deep as you suggest. To specifically come up with reasons to go against your potential trade is a great idea and I will add this to my arsenal. Thanks.
I totally agree. It's nice to see your kill zone coincide with mine. I have been watching the ab=cd harmonic pattern develop and will discuss it when it gets closer to completing. Nice to see a harmonic/fib trader on here. I have been following you and dig your analysis. Keep it up and thanks for commenting and posting your chart.
Like you said, these are only levels that could easily be broken and we can never get too confident while trading. I look forward to more of your analysis and charts.
Lots of value and insight into the topic thank you poster for this informative way of trading will put it into practice ..
Thanks for your comment @nate7777777 If you have any questions feel free to ask.
UPDATE 2
Please follow my continued analysis on this pair here!