You are viewing a single comment's thread from:
RE: Steem Price Technical Analysis - Support Breaks Down, New Lows and What's Next for Steem
Well presented case. An approach I like to use once I have worked through the trade setups, is to compile a list of REASONS NOT TO TAKE THE TRADE.
These can be technical reasons like a resistance or support line (horizontal or trend) in the way; upcoming news; competing signals in opposite directions; mindset not right.
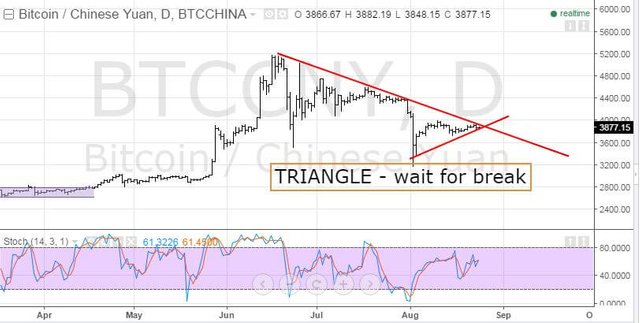
There may be value in sharing thoughts on what is happening on BTC charts. For example, with BTCCNY in a triangle hard to see Steem going long

Note: I used CNY because the chart is clean - I have scrawls all over my BTCUSD chart
I like this idea a lot. I am doing this before I make a trade. I somewhat do it when I break down "the case for the bulls and the bears" but I don't go as deep as you suggest. To specifically come up with reasons to go against your potential trade is a great idea and I will add this to my arsenal. Thanks.
I totally agree. It's nice to see your kill zone coincide with mine. I have been watching the ab=cd harmonic pattern develop and will discuss it when it gets closer to completing. Nice to see a harmonic/fib trader on here. I have been following you and dig your analysis. Keep it up and thanks for commenting and posting your chart.
Like you said, these are only levels that could easily be broken and we can never get too confident while trading. I look forward to more of your analysis and charts.