Steem Price Technical Analysis - Are the Bulls Gaining Control?
The STEEM/BTC pair has been consolidating for the past week, yet the question remains, who is in control.. the Bulls or the Bears?
This is my continued analysis on the STEEM/BTC pair on the 120 minute timeframe. Please see my previous posts for greater insight into this pair.
If you have been following my analysis on the STEEM/BTC pair you will have known I have been bullish on Steem for quite some time, and I am happy to report that yesterday we hit our first target!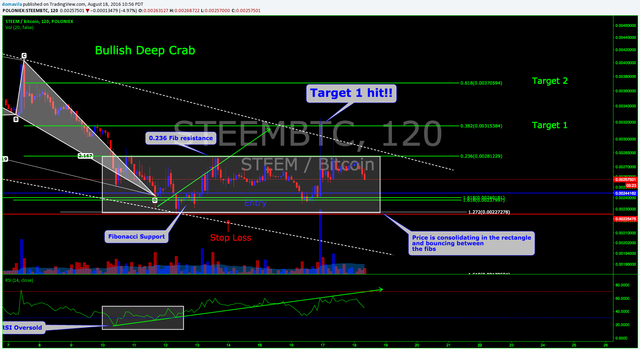
View Image
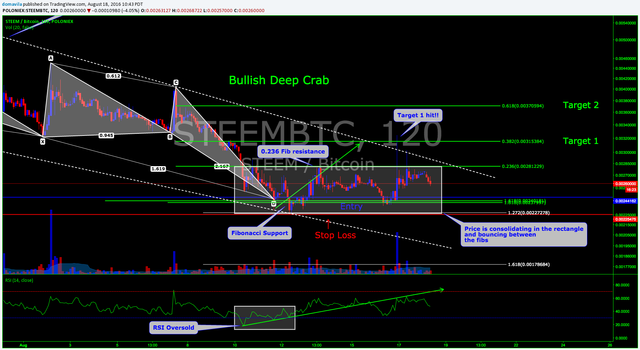
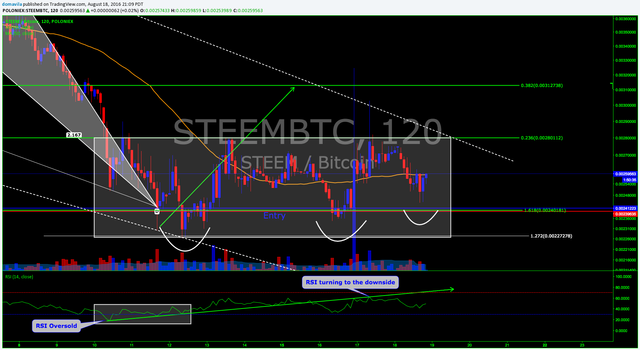
As can be seen on the chart, price spiked up and finally hit Target 1 at the 0.382 fibonacci level after a week of consolidation. This example shows the power of Harmonic Trading, the Deep Crab and how wondeful this methodology can be if implemented correctly.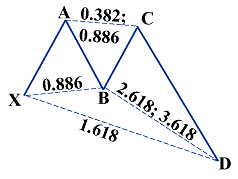
According to my trade plan and the methodology of Harmonic Trading, I close half of my position once Target 1 is reached and I keep the remaining half of my position open after raising my stop loss to break even. This process serves three purposes. First, by closing half our trade we have secured profit and have a winning trade. Second, by leaving the remaining half of the position open, we can let our winner rise to greater profits. Lastly, by raising our stop loss to break even we are protecting our capital and are assuring the fact that this trade is a winner. Even if we get stopped out at break even, we have already banked profits and have nothing to loose. I love playing with house money.
So who is in control now, the Bulls or the Bears?
This is tough to say. Since I am currently long on Steem, it should be apparent that I think the bulls are in control but if there is one thing that's for sure, nothing is certain in trading.
The Bears have been pushing down price for quite some time and have been in control for the past month, I don't think they are ready to give up quite yet but the Bulls are definitely showing some strength.
Case for the Bulls
- The Bullish Deep Crab
After the bullish Deep Crab completes we often see price reverse and react to the upside. We witnessed this happen when price shot up to the 0.382 fib and we hit Target 1. This is definitely bullish and the typical reaction we see when trading the Deep Crab.
Higher Highs
The Bulls continue to put in "higher highs" while the bears are failing to print "lower lows" - this is bullish.
The Double Bottom
It looks like a double bottom has formed and price has found support. The double bottom is usually a bullish pattern and many traders will take a position on this pattern alone.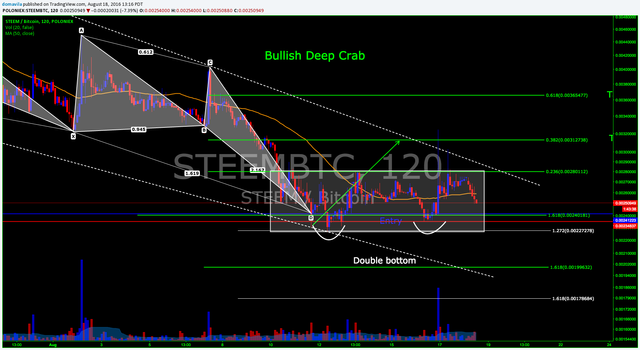
View Image
Case for the Bears
- Descending channel
We have been in a descending channel for nearly a month and until we see a breakout of the channel to the upside this remains bearish.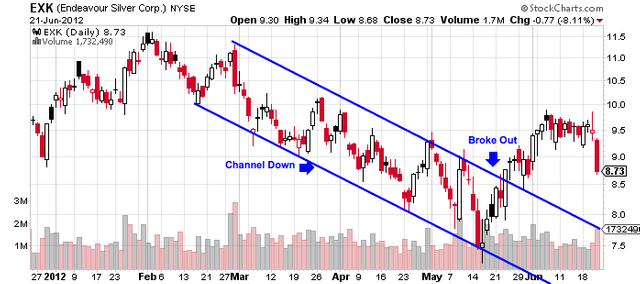
- Price rejection
Every attempt made by the Bulls to push price to the upside is rejected by the Bears. The Bears refuse to let price break out of the channel and until this happens will remain bearish in sellers eyes.
- The 50 MA
Price is currently trading under the 50 MA which is short term bearish.
RSI
On the 120 minute timeframe RSI is currently trending down. We could possibly see RSI retest the oversold territory and price could follow in its wake.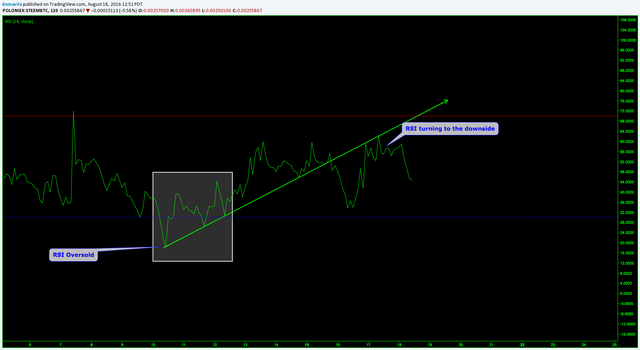
View Image
Conclusion
Although price is still in the descending channel and trading below the 50 MA, the bears have failed to print "lower lows" these past few days. This combined with the completion of the bullish deep crab and double bottom show me that price could have found major support in this area and we could be witnessing the beginning of a trend reversal. I must add that price could retest previous lows forming a triple bottom. If this occurs and support holds I believe we will see a breakout to the upside. It looks like we are just going to have to sit back and watch this one play out.
If you would like to see this trade play out in real time please click here.
Update
Once again sellers tried to push price lower and failed for the time being. It looks like a triple bottom has formed which is a nice bullish sign, but the last time we had a triple bottom support failed on the fourth retest and dropped to all time lows. This shows us that patterns can fail and often do.
Today, although we had higher lows, we did not have higher highs so the direction still remains unclear. Let's see if the bulls can push price past the 0.236 fibonacci at the 0.0028 BTC mark and sail away to higher highs and a possible breakout.
View Image
Though I am a Fan of candlesticks , I agree with you on "the bears have failed to print "lower lows" these past few days." But as per my analysis of Candlesticks, I do see an "evening Start" Followed by it's confirmation by a "Bearish engulfing" . So the Fall is inevitable.
@venkat I am a fan of candlesticks too. Especially hammers and engulfing candles but I find them more accurate on the daily and 240 minute timeframe. Although I am primarily a harmonic trader I use candles and price action in the PRZ as triggers for trade entries.
Remember, nothing in trading is inevitable! Thanks a lot for your comment, I really appreciate it when people comment especially if it is the opposing view. When I get home I will check those candles out!!