STEEM Technical Analysis + Current Direction - 24 July 2017
In one of my recent Posts, I had said that a Decline is a possible scenario for STEEM. A brief recap: STEEM could decline and touch $1.40 if so it could even go lower to $1.30 it did touch $1.44 and retraced back toward the $1.60 Meaning that we are looking at a more stable trend movement at this time.
And reaching a High Yesterday of 1.81
Today's High so far is $1.65
When we compare the Trends from 2 Days ago and Today we see some differences.
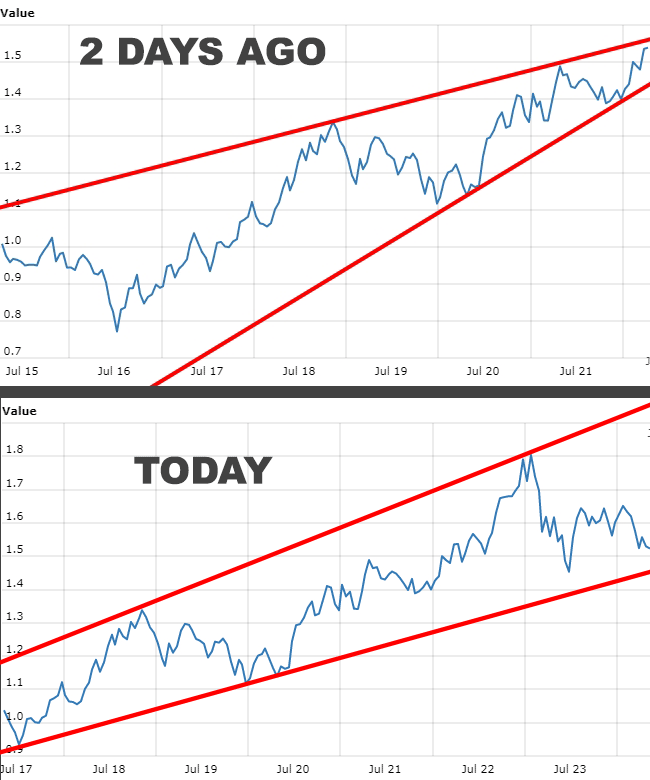
First of all, STEEM went through a compressing as I said 2 days ago and this compressing has brought about a direction for the market to move towards, It was most likely that STEEM was gonna decline as a result of touching the top Trend line.
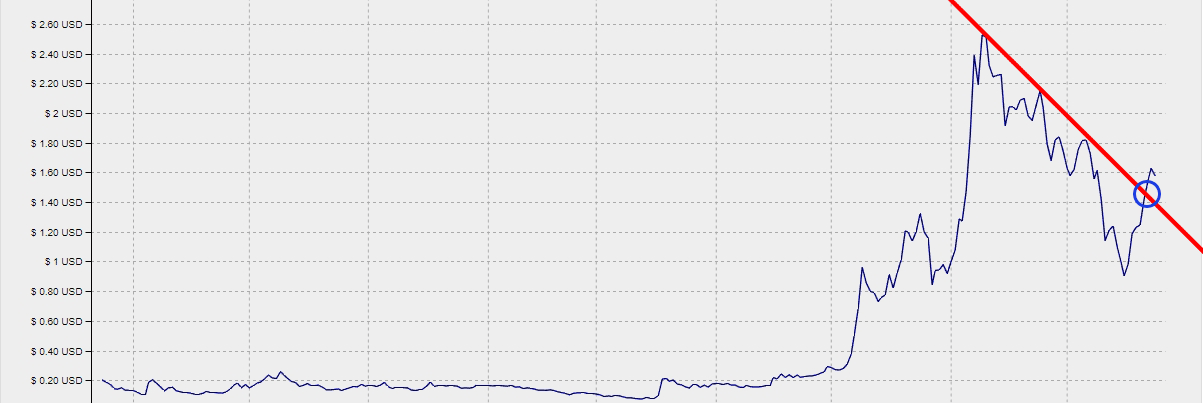
☑ This did in fact happen and STEEM Touched the $1.44 Price Range and Retraced back up. After that STEEM began to move once again into Consolidation.
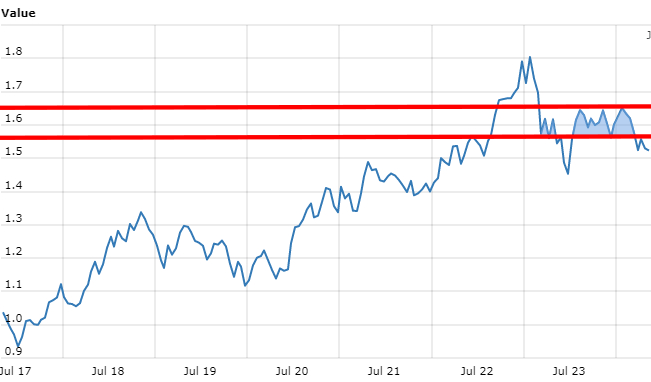
☑ We could, however, draw an extra Support Line to pinpoint possible price movement at this time.
☑ A possible decline to $1.48 Is a possibility today which would mean STEEM would have to touch the bottom Support Line.
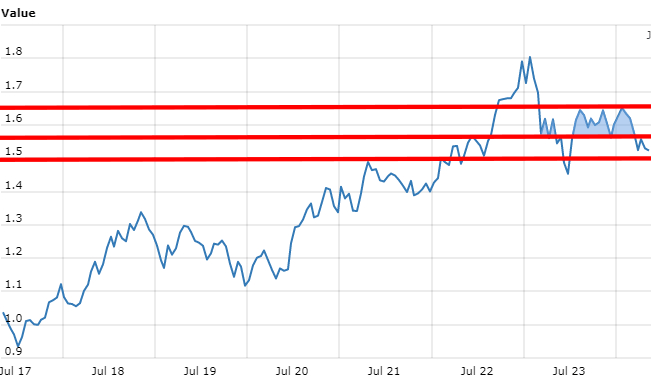
We are not done yet!
☑ Below we can see that the top Tend line is pushing and is the most dominant one at this time. Thus the possibility of STEEM dropping further is strong, especially if the $1.48 gets triggered today.
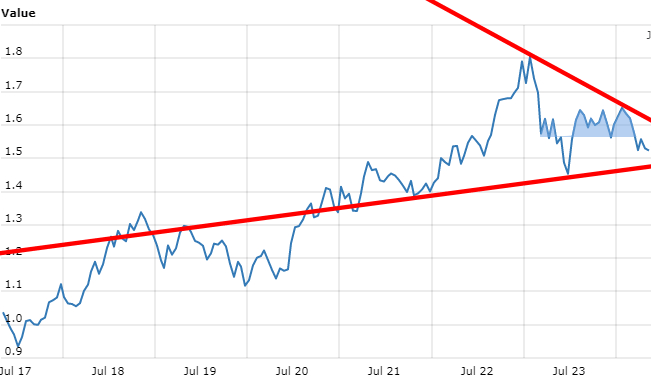
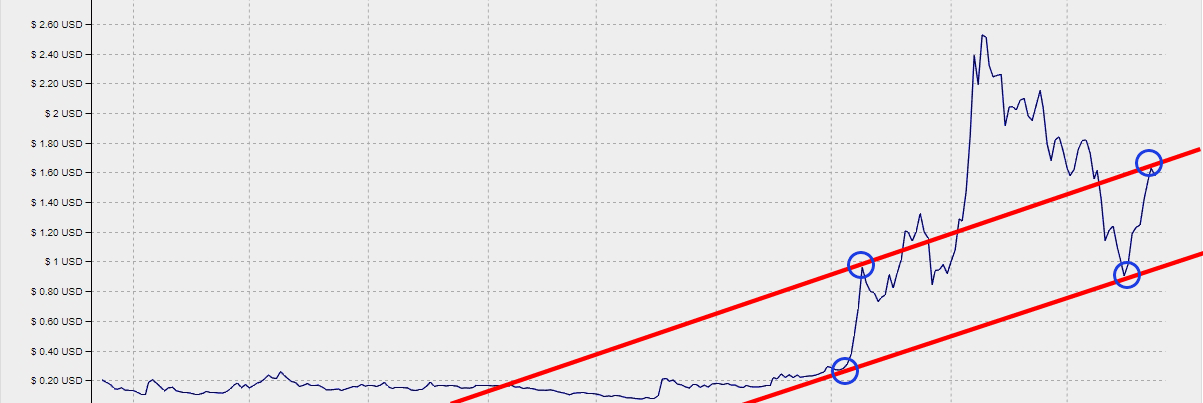
☑ The market for the long term is moving as shown below
Following an Uptrend.
☑ A breakout occurred on the Downtrend as shown below.
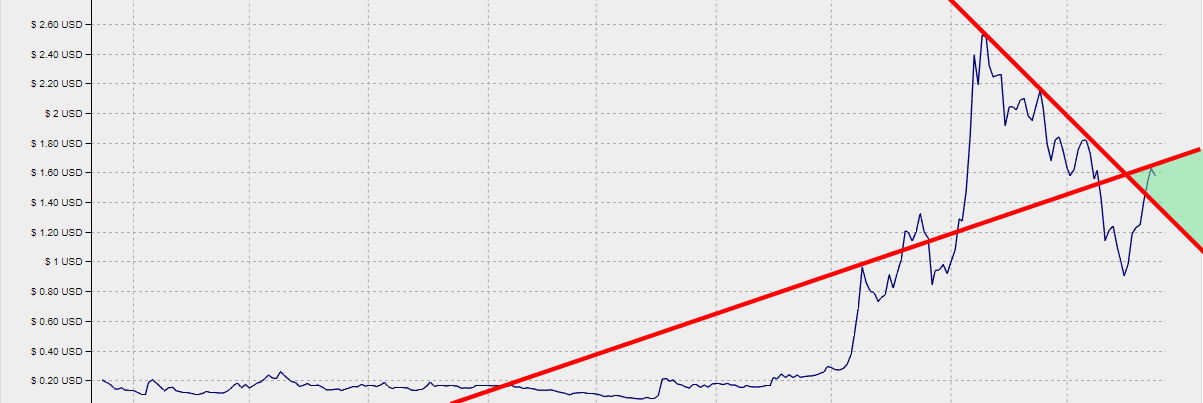
☑ STEEM is as a result of the breakout moving into consolidation and I love it when STEEM does that because the strongest pattern from STEEM after consolidation is an Uptrend :)
The Green Triangle marks the path STEEM could be taking as a result of the current consolidation.
Follow for more Analysis Updates
Check out my Recent Posts


I love your blog,i already follow you.i am a new person,so i need your halphand .please follow and vote me this link
https://steemit.com/@shahaalam19