My research on Wader bird diversity, in South Africa across Time
For background on the field data collection with pictures, see my post: https://steemit.com/nature/@kiekie/my-science-project-in-south-africa-the-story-and-photo-s and https://steemit.com/nature/@kiekie/my-swift-bird-story-and-photo-s
This is my scientific article I have to hand in for assesment. I hope you enjoy the study and please give some tips on article writing that I can apply before handing it in.
.
.
Wader (Charadrii) diversity across space and time at Langebaan Lagoon
Abstract
Wetland ecosystem structure and function can be represented by the diversity and distribution of the inhibiting wader bird species (family Charadrii). By understanding the relationship between Langebaan Lagoon’s wader species’ communities and their environment, conservation methods can be applied accordingly. Langebaan Lagoon is one of the most important wader bird sites in the world and reports indicated the wetland to be under threat. This study compared the diversity of four communities across different tidal flats to generate a relationship between the diversity of the waders and their environment. Mudflats were found to hold the most diversity, abundance and species richness. The abundance of the present study is compared with studies done before the establishment of West Coast National Park (in 1985) to visualize the change in wader populations since 1958 , but showed no sudden change in relative abundance and species richness which can be implied that management since 1985 had no negative effect on the wader populations during January. This study states the importance of conserving large mudflat areas and that the present wader populations did not develop a skewed species richness ratio which could influence the ecological system of Langebaan Lagoon wetland. The wetland is well managed, but require permanent conservational management.
Keywords
Wader birds, diversity, species richness, abundance, community distribution, tidal flats
Introduction
Ecosystem structure and function can be analysed by its inhibiting species diversity and richness across space and time (Mendez et al., 2011; Robinson et al., 2017). For example, Wetland ecosystem system can be represented by the wader bird species (family Charadrii) due to waders being present in all types of wetlands across the world (Hafner, 1997; Turpie, 1995; Whelan et al., 2003).
The ability to conserve wetlands and wader birds, dependently and independently of each other, the relationship between its wader species’ communities and their environment must be understood (Turpie, 1995). To understand the relationship, studies concerning the ecology of waders are needed and the biological importance of wetland sites of the waders (Whelan et al., 2003). Not only would ecological relationship explain the structure and function of a Wetland, but it can also be used as indicators of the migratory waders’ patterns, directions and locations for conservational use (Hafner, 1997).
The ecology and diversity of waders were considered by Mendez et al. across Great Britain (2011). They looked at the relationship between waders and its environment through the concept of Functional Diversity. Functional Diversity refers to the variety of lifestyles and ecological roles of species across different environments. This index was based on monitoring population sizes, species traits, distribution and temporal trends according to most favoured sites. Their study aimed to establish drivers in wader population trend to enable conservation. One such driver is human disturbances. The impact of human disturbances was analysed by Whelan et al. for New Zealand and Australian Wetlands through Waders. They compared the wetland’s biological importance with the wader’s physical traits to be able to map out possible locations to inhibit large diverse wader populations for conservation.
Langebaan lagoon is classified as an important wader site by BirdLife International (2018), State Report (2006) and other published studies (Liversidge et al., 1958; Pringle & Cooper, 1975; Summers et al., 1977; Underhill, 1987; Mendez et al., 2012; Turpie, 1995). The State report of 2006 thoroughly analyses the abundance of water birds present during winter and summer and found that waders compile most of all water birds throughout the year, but during summer, the addition of the Palaearctic waders, a more variety of wader species are found (85% of all water birds) (Atkinson et al., 2006).
This lagoon is an extremely important non-breeding grounds for migratory birds and is able to host bird species from all over the world in one location within relatively the same time period (austral-summer) (Summers et al., 1977; BirdLife International, 2018; Atkinson et al., 2006).
Several reports which analysed the Langebaan Lagoon wetland (BirdLife International, 2018; Atkinson et al., 2006), created a great consideration to conserve this wetland. BirdLife International (2018) assessed the area in 2013 and found the two main threats, for the waders and the wetland, to be Human Intrusions and disturbances and Pollution which are both caused of humans’ activity (BirdLife International, 2018). A Status report done in 2006 on the Saldanha Bay, its Islands and Langebaan Lagoon area (Atkinson et al., 2006), water bird species populations were considered according to the different environmental types, to reflect the function of the Wetlands and Shore systems. Their data was based on from previous studies (Liversidge, Broekhuysen & Thesen, 1958; Pringle & Cooper, 1975; Summers, Cooper and Pringle, 1977; Underhill, 1987; literature is reviewed in this paper) and more recent census done by the Wader Study Group and Co-ordinated Water Bird Counts (Atkinson et al., 2006). By combining the results of the studies, the report concluded a decline in the wader population, the resident waders at a faster rate than the migratory waders.
Langebaan Lagoon was declared a National Park since 1985, and human activities declined due to a strictly controlled management system (Atkinson et al., 2006). Census done after the establishment of West Coast National Park are done continuously throughout the park with the presence of conservational management by several study groups such as BirdLife and the Avian Demography Unit of the University of Cape Town (Atkinson et al., 2006). As such can the comparability of census data obtained before and after 1985 be questioned. But with that said, before 1985 the area was well known for the shooting of birds and other human activities (Gill, 1934).
Very few studies focused their research on the diversity of the wader population in Langebaan lagoon during Austral-summer and combining the data with abundance census to analysis the waders, to get a broader idea of this wetland system. Whelan et al. (2003) and Turpie (1995) did study the diversity, but not within the same space and time as this study. Whelan et al. had done their research on Great Britain where Turpie (1995) looked at several Southwestern Africa wetlands. Turpie (1995) analyses the wetlands through wader diversity and abundance to establish how conservation should be applied. Similar to Turpie (1995), the purpose of the present study is to understand the system of Langebaan Lagoon Wetland through Wader populations by analysing their diversity and abundance among communities for conservational purposes, but with more focus on different tidal flats rather than different wetlands. Previous studies done on wader birds in Langebaan Lagoon, mostly base their analysis on the abundance of the wader species and environmental aspects and does not focus on the diversity index of the communities within the Lagoon (Summers et al., 1977; Pringle & Cooper, 1975; Liversidge et al., 1958).
This study addresses the shortcoming of the diversity analysis by focussing on different communities within different tidal flat types and including the beta diversity analysis which has not been considered in the above-mentioned papers. Mudflats contain more prey abundance (BirdLife International, 2018; Whelan et al., 2003; Atkinson et al., 2006) and this study hypothesis higher diversity on mudflats than sandflats. This study will also address the change in relative abundance since early 1958. Due to the State Report (2006) stating a decline in waders, this study hypothesis a change in relative abundance between species. Although previous studies look at different species traits and environmental aspects (Underhill, 1987), this study is restricted to the counting of birds without a thorough analysis of the environment. This study will only consider different tidal flats as an environmental factor of influence.
Establishing the wader birds’ distribution over space and time, thus to understand the wetland ecosystem, the following objectives are made: (1) the wader diversity, species richness and abundance are compared within communities, between communities and to different tidal flats, to understand spatial and temporal distribution, (2) comparison of species’ relative abundance with studies done before the establishment of West Coast National Park to assess the impact of conservation of waders since 1985.
Literature review
Wader populations have been observed since 1934 (Gill, 1934), but the census of waders was only published from 1937 onwards (Atkinson et al., 2006; Liversidge et al., 1958). Studies done before the establishment of West Coast National Park was done under different methodology and published their results in different formats. For these reasons could the following studies not be directly compared, but rather through relative abundance.
Liversidge et al. published their results in 1958, but the methodology wasn’t very stable and uniformly applied during their observational time period of December 1937 to July 1953. This study had no fixed observational location, with most between Oesterwal and Geelbek, and recorded the species abundances of three ecological bird groups: Palaearctic wader, sea birds and freshwater waders. Due to their lack of structure in their methodology, the published result format was the highest number per species. An observation of the migratory waders was made that the highest abundance was present during March at Langebaan Lagoon and departed about September.
A follow-up study was done by Pringle & Cooper (1975) observed from March 1973 to November 1974 from three fixed locations: Bottelary, Rietbaai and Stofbergsfontein. This study recorded the population size per species through average abundance per area. This study had a more strict methodology, focussing on calculating the observational area as well. Their observations were done from their observational location for the whole visible area. The same observation as Liversidge et al. was made about the seasonal abundance variations of the Palaearctic waders’ migratory patterns. Relative Abundance variations were found between the two studies, but the most abundant species found in both studies varied slightly. These species are the Curlew Sandpipers (with 67.9% average population size from Liversidge et al. study against 64.2%), Grey plovers (15.7% against 12.9%) and Sanderlings (5.7% against 5.2%).
Not long after the publication of this study, a regional study was done to compare the different sites along the southwestern Cape, their environmental types (different wetland types vs different coastal shore types) and wader abundance and species richness. The observational period was mainly between December 1975 and January 1976 (austral-summer). From 98 observational sites were Langebaan concluded as the most important migratory site due to it hosting the highest total number of waders (43% of all the sites) during this time frame. This study published the number of birds counted during this time frame for Langebaan lagoon and other important sites.
In 1987 Underhill published his census, who only counted the birds during summer (January or February) and winter (June or July) to compare against food availability during the two seasons. His study covered 11 summers and 12 winters, from 1975 to 1986. His observational area ranged between 50 to 100 hectares per year’s observation. This publication considers energy consumption of the non-wader birds and waders birds relative to the abundance encountered each season. Due to the long-time period and a well detailed table containing counted abundance and food consumption per species, this is a well referenced article (Atkinson et al., 2006).
All four the above mentioned studies counted accordingly to tides and concluded the most abundance of waders is during the austral-summer (December to March). These studies all agreed that the most abundant wader species include the Curlew Sandpiper (as well as by Gill, 1934), Sanderling, Red Knot, Grey Plover and Runny Turnstone.
Methods
Study area
The study was conducted along the Langebaan Lagoon, which extends from Saldanha Bay inland, in West Coast National Park (Figure 1). The park is a protected environmental park proclaimed in 1985, situated north of Cape Town (Atkinson et al., 2006), and areas within the park, the Lagoon and the islands of Saldanha Bay, have been identified as an important bird area by BirdLife International (2018). Langebaan Lagoon is a 17.5 kilometres long marine lagoon, stretching from Saldana Bay and end in a marshland at Geelbek, and have a maximum width of four kilometres (Google Maps, 2018). Due to the layout of the lagoon, a variety of tidal heights and timing are found, creating different tidal flats types. Tide can have an influence on the abundance of prey through the amount of water coming in and out in an area (Whelan et al., 2003). Tidal flats can have an impact on the distribution of wader species due to the prey abundance and diversity (Atkinson et al., 2006).
This study considers two tidal flat types which are the mudflat (end zone of the lagoon, the Geelbek marsh area) and the sandflat (the Seeberg and Preekstoel beaches).

Study census
The lagoon is a conservational area implemented with the local population access within certain zones, thus are the different tidal flats and locations, from where observations were done (Figure 1), exposed to different levels of human activity. To compensate for this exposure, two sandflat locations were chosen with one inside a hide (excluding human presence) and one without a hide (including human presence), which are respectively the Seeberg Bird Hide (33,12648° S; 18,05859° E) and Preekstoel beach (33,1508° S; 18,03788° E). The mudflats are represented by two sites in Geelbek, the Geelbek Bird Hide being the human absent site (33.19011° S; 18.12382° E) and a Hide absent location (33.194399° S; 18.121746° E), respectively referred to in this article as GeelbekA and GeelbekB. Tidal flat types were recognised by observation.
The census was done from the above mention sites (Seeberg, Preekstoel, GeelbekA & GeelbekB) (n=4). From these points, a vantage point of 180 degrees was selected for a census region with a 200-meter radius (which was estimated with the eye and with the use of local selected markers). Only birds that touched the soil within the study area was counted, thus excluding any flying waders. Counting within one hour was done by two to three observes to minimise observational error.
Census was done over six days in January 2018 (24th to 29th), with a second day interval for the two tidal flats (n =2) resulting in three-day observation for each site (n = 3). For every day and site, observations were done for an hour at the diurnal mid-intertidal zone for inflow and outflow tides (n=2). Thus, from all the considering influential factors (Site, Hide, Tide, Day) a total observational number of 24 are done.
Statistical analysis
Several indices are considered to quantify the diversity and abundance of the wader communities:
(1) Species Richness: the total number per encountered species.
(2) Alpha diversity calculated by Shannon’s Diversity Index (H’): the ‘evenness’ of species abundance across species richness. As such, will higher values present communities where more equally abundance per species are found (Turpie, 1995).
(3) Abundance: the total number of individual birds per area.
(4) Beta diversity calculated by Horn–Morisita index (C_λ): the diversity between species and sites (Wolda, 1981). This index was chosen because this index avoids the effects of sample size and alpha diversity and due to the transformation of data is Horn–Morisita index preferred over Morisita index (Wolda, 1981).
The Alpha diversity was calculated through the vegetarian package with Shannon’s Diversity Index (H’). H’ values were tested for normality with a Quantile-Quantile normality plot and Shapiro test. The necessary transformation of the abundance data (n=24) was done with Wisconsin-transformation (package vegan) to normalize the original data. Site, Hide, Tide and Day were tested with the One-way ANOVA parametric test to establish whether there is a significant difference between the groups within each factor with the calculated H’ values. The species richness was estimated through gamma diversity in the vegetarian package. A separate One-way ANOVA was run between the H’ values and tidal flat types.
Beta diversity (4), in this case, is measured between species (n=28) and replications (n=24). It was measured through the Horn–Morisita index (C_λ) in the vegan package. An appropriate PERMANOVA test was run to establish the significant influence that the four influential factors have on the beta diversity values. Beta diversity is visualised in a Multi-dimensional scaling (MDS) plot (package vegan), within which the four sites are identified. The SIMPER function (package vegan) establishes the species driver affecting the diversity between communities. Spatial distance between sites was estimated with the earth.dist function in the package fossil.
Results
Species composition
The total wader species encountered were 28, and the list can be seen in Table 1. For GeelbekA and GeelbekB sites, there were 22 and 19 species respectively observed. Preekstoel site contained only 14 of these 28 waders and Seeberg site had 17 species. The total abundance of wader birds over the four sites respectively for GeelbekA, GeelbekB, Preekstoel and Seeberg is 3168, 1084, 1212 and 474. The Curlew Sandpiper is the most abundant species at GeelbekA (total = 1463) as well as GeelbekB (total = 477) with Sanderlings (total = 304). For Seeberg, the Greater Flamingo (total = 271) and Sanderling (total = 378) were the most abundant and in Preekstoel, the Sanderling (total = 180). With GeelbekA containing 606 Sanderlings, Sanderlings are the most abundant, evenly spread species over the four communities. The overall most abundant of these species were the Curlew sandpiper and Sanderling.
The two Geelbek locations are located 0.52 kilometres from each other, Seeberg and Preekstoel sites are 3.32 kilometres apart and the other spatial distances range between 9.1 and 9.5 kilometres.
Shannon’s diversity (H’) Index and Species richness
Abundance data was transformed with Wisconsin-transformation to get a normal distribution among the H’ values (W = 0.96155; p-value = 0.4703).
With One-way ANOVA, the Site factor was proven to have a significant influence on the H’ values (p<0.01) (Table 2). The effects of a hide being present or not had a significant influence (p<0.05), but are combined per site to create a non-bias data set. Both Tide and Day factors were found non-significant (p>0.1). A separate One-way ANOVA was run for the mud- and sandflats against the H’ values and heeled significant with a p-value of 0.00469. Shannon Index for alpha diversity (H’) within a community, resulted in GeelbekA to have an index of 12.993779 and GeelbekB a diversity index of 9.206713. Seeberg contains an H’ value of 8.878382 and Preekstoel 7.177134 diversity index (Figure 2).
Beta diversity
Horn–Morisita index (C_λ) diversity among the communities, visualized in the Multi-Dimensional Scaling (MDS) plot, shows an overlap of GeelbekA and GeelbekB, creating three distinct communities with the Seeberg community and the Preekstoel community (Figure 3). The C_λ values are only influenced by the difference in Sites (R^2=0.53732; p=0.001) with no significant effect by Tide (R^2=0.05436; p=0.058) nor Day (R^2<0.05; p>0.05) (PERMANOVA). The SIMPER equation between mudflats (GeelbekA & GeelbekB) and sandflats (Seeberg & Preekstoel) shows that the Little Egret (average = 0.047347), Blackwinged Stilt (average = 0.042488) and Grey Plover (average = 0.041609), Whitefronted plovers (average = 0.040644) causing the most difference between the tidal flats. Between the two Geelbek locations, it’s the Pied Avocet (average = 0.036695) and the Threebanded Plover (average = 0.035724) causing the most difference in diversity. Between Seeberg and Preekstoel is the Greater Flamingo (average = 0.076251) and Grey Plover (average = 0.070546) the main influential species. Between GeelbekA and Preekstoel it’s the Little Egret (average = 0.063857) and the Grey Plover (average = 0.060275). GeelbekA and Seeberg show a species driver in diversity as the African Black Oystercatcher (average = 0.058991) and Greater Flamingo (average = 0.053914). The species contras between GeelbekB and Preekstoel is the Little Egret (average = 0.063039) and the Grey Plover (average = 0.055247). The species of GeelbekB community and Seeberg community differ mainly due to the African Black Oystercatcher (average = 0.058991) and White fronted plover (average = 0.047266).


Discussion
Diversity
The present study compared the relationship between diversity, species richness and abundance to establish a relationship, between communities and tidal flats (Żmihorski, Berg & Pärt, 2016). The relationship between these biodiversity metrics can be used to understand the waders’ patterns of biodiversity distribution (Mendez et al., 2011) and ecology (Hafner, 1997), which can clarify dependence of waders on environmental types (Robinson et al., 2017), predict temporal trend and migratory patterns (Hafner, 1997). This knowledge can reflect the wetland system and function of Langebaan Lagoon. Since the early 1900’s studies on wader in the Langebaan Lagoon stated that it is one of the most important bird sites in the world, can thus be assumed that the Langebaan Lagoon have a very well-structured wetland system. The hypothesis states a higher diversity to be found on mudflats. The objective of establishing a relationship between diversity, species richness and abundance according to the tidal flats established the hypothesis to be accepted.
The relationship between abundance, species richness and alpha diversity (Figure 2) is positive in this study for all the communities. The four communities stay constant within a relative pattern between communities for Shannon Diversity Index, species richness and total abundance, respectively.
The dependence on environmental types is reflected through this relationship between biodiversity metrics and communities. The study was restricted to analyses environmental drivers of wader diversity due to the strict conservational system, but a trend across tidal flat types was found. The distribution across different tidal flats by different wader populations show the biological importance of the different flats within biotic communities (Whelan et al., 2003) and between wader populations (Hafner, 1997). A preference for mudflats was seen through the high alpha diversity and species richness within the Geelbek communities compared to the two sandflat communities. This is also confirmed by a higher total abundance of waders at Geelbek than Preekstoel and Seeberg combined (Figure 2). Mendez et al. (2011) had the same problem concerning restrictions to study environmental drivers, they in turn, found a diversity trend in waders across longitude in British wetlands. In their study species richness decreased from west to east across their considered wetlands.
The alpha diversity, species richness and abundance were considered only per community, but diversity variance is also needed between the communities to establish the relationship between the waders and their environment (Turpie, 1995). The Multi-Dimensional Scaling (MDS) plot (Figure 3) show visually the diversity relationship between and within the communities, regarding the diversity of communities and its species. Preekstoel and Seeberg are distinct communities, with very few overlaps in species abundance and richness with the other communities. Site GeelbekA and GeelbekB have overlapping beta diversity and can thus be considered as one community, or two sub-communities. This MDS plot can possibly also reflect the spatial distances between the communities selected. This may partly explain the MDS plot distribution for the communities and should be kept in mind when choosing locations for future studies. The SIMPER method also confirms that Geelbek acts as one community, because both GeelbekA and GeelbekB sites respectively with Seeberg and Preekstoel sites showed the same species driver with similar SIMPER averages.
Through this study, a significant influence was found for human presence in wader communities. To establish a better understanding of how human presence, affect the communities, further studies are needed due to this study only comparing two absent hide sites with two present hide sites over different tidal flats. Not only could human presence be a possible influence on the census, but the variable conditions in which observations were done. Due to observation been done according to tidal times, different conditions were encountered due to the different daytimes, for example sun position. With one recording at the GeelbekB site during outgoing tide census, the wind shook the scopes and the sun glare was strong, and during the last observation done at the Seeberg site, the outgoing tide had a very fast rate. The tidal rate varies due to the layout of the Langebaan Lagoon, which makes calculating the correct tidal time for each site difficult. The two mudflat sites were too close to each other, representing very few changes between the two locations, in tide and conditions. Due to lack of time and resources, this was the best choice for the study. A future study needs to choose a different mudflat site to compare with Geelbek, as one site.
Abundance
To assess the system of the Langebaan Lagoon wetland over time, the present study is compared to studies done by Liversidge et al. (1958), Pringle & Cooper (1975), Summers et al. (1977) and Underhill (1987). The comparison was done through species’ relative abundance over the five studies, due to the different methodology and published result formats (e.g. maximum, median & average). This comparison between published studies, done before the establishment of conservational management, and the present study can reflect the impact of the conservation on waders since 1985 (Atkinson et al., 2006). Due to the State Report (2006) stating a change in abundance, this study hypothesis a change in relative abundance between species. The hypothesis is rejected, but with caution. By comparing the studies, the differences in methodology, observational sites, observational period and result formats should be kept in mind.
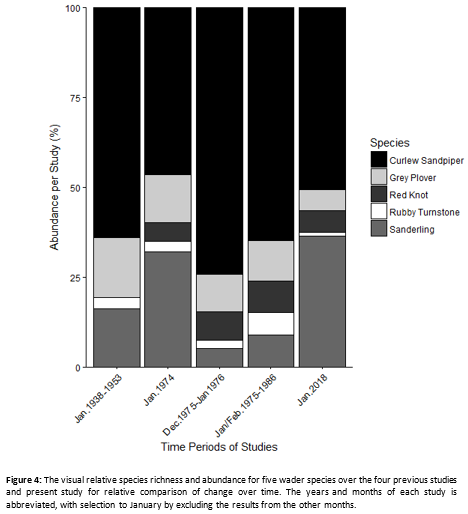
By only comparing data from austral-summer, specifically January, with the data of the present study, Figure 4 could be created. Five species are considered in all five studies and can be used as a representative of each study during January for each studies’ time period. The species are the Curlew Sandpiper, Grey Plover, Red Knot, Sanderling and Rubby Turnstone. The best way to exclude the variety of published results formats, the percentage of each species of the five for each study was calculated (Table 3) to be placed in a stacked bar graph (Figure 4). The abundance of these five species varies constantly, with the exception of zero abundance of Red Knot in the Liversidge et al. (1958) publication. The absence of Red Knots in this publication could be due to the weakly structured methodology. The present study does not vary extensively from the previous studies and fit in well with a relative abundance pattern. Since early 1900’s to 2018, the relative species richness and relative abundance vary constantly without any sudden changes between these species. The Curlew sandpiper is the most abundant wader species during January, followed by the Sanderling. Rubby Turnstone and Grey Plover are constant in relation to the other species. Red Knot is constant in visual ratio with the other species since 1974. Gill (1934) wrote that he observed, during April 1934, the Curlew Sandpiper to be the most abundant of all the wader species. Thus, can be said that since 1934, and possibly earlier, have the Curlew Sandpiper been the most abundant wader species during austral-summer at Langebaan Lagoon.
Form this representation of the differences among years for wader populations (Figure 4; Table 3), the constant variation ratio between species can imply that the presence of conservation did not affect the waders negatively by creating a skewed species richness of waders. The hypothesis stating a change in relative species richness and relative abundance are thus rejected.
The assumption of a positive reflection of conservational management cannot be confirmed without more studies, which are ongoing (Atkinson et al., 2006). This study can only state that the conservation did not have a negative effect on in relative species richness and relative abundance.

Conservational management
The ecological function of a wetland is depended on the variation in biodiversity and environment (Mendez et al., 2011). Management of wader bird conservation in West Coast National Park should consider all tidal flat type equally important keeping in mind that if disturbances are found close to mudflats, that the loss of wader populations and diversity will be greater. Conservational management should thus conserve all tidal flats equally, but with extra caution to mudflats.
The abundance comparison over time shows a non-negative management system in relative species richness and relative abundance after the establishment of the park. The comparisons show no skew ratio towards any on the five species over time, which is good for the ecological system of the Langebaan Lagoon wetland (Turpie, 1995) and show that since the establishment of the park in 1985 the park was well managed.
Access to the park to do research was very restricted, resulting in less influential factors that could be considered and assessed. Although the pre-1985 studies were done in the absence of management, some studies only considered abundance, excluding environmental drivers, by choice (Liversidge et al., 1958; Summers et al., 1977; Pringle & Cooper, 1975). A lack of similar methodology greatly reduces the ability to make comparisons.
These restrictions are easily overcome through West Coast National Park assessing the wader communities themselves and other national and international study parties such as BirdLife International, Avian Demography Unit and Co-ordinated Water Bird Counts. These studies are all very thorough, but with different structure in methodology and database publication (BirdLife International, 2018). Some do not publish their data, while other parties publish without similar result formats (Atkinson et al., 2006). A universal database, where all the different study parties combine their data will be of great help for conservation. The beta diversity index in wader censuses are lacking and have can broaden the understanding of the wetlands through wader birds. With an agreement with all studies parties to use the same diversity indices and methodology, a well-defined universal database of information will be the best source for conservational management.
References
Atkinson, L., Hutchings, K., Clark, B., Turpie, J., Steffani, N., Robinson, T. and Duffell-Canham, A. (2006) State of the Bay 2006: Saldanha bay and Langebaan Lagoon. [online] Cape Town: Saldanha Bay Water Quality Trust, pp.81-85. Available at: http://www.health.uct.ac.za/sites/default/files/image_tool/images/91/State%20of%20the%20Bay%20Report%202006.pdf [Accessed 5 Apr. 2018].
Becker, R. A., Wilks, A. R., Brownrigg, R., T. P. Minka & Deckmyn, A. (2017) maps: Draw Geographical Maps. R package version 3.2.0. https://CRAN.R-project.org/package=maps
BirdLife International (2018) Important Bird Areas factsheet: West Coast National Park and Saldanha Bay islands. [online] Available at: http://datazone.birdlife.org/site/factsheet/west-coast-national-park-and-saldanha-bay-islands-iba-south-africa [Accessed 5 Apr. 2018].
Charney, N. & Record, S. (2012) vegetarian: Jost Diversity Measures for Community Data. R package version 1.2. https://CRAN.R-project.org/package=vegetarian.
Gill, E. (1934) An afternoon with the waders. Ostrich, 5(2), pp.57-59.
Google Maps. (2018) [online] Google Maps. Available at: https://www.google.com/maps/@-33.1110597,18.0211683,12z [Accessed 5 Apr. 2018].
Hafner, H. (1997) Ecology of Wading Birds. Colonial Waterbirds, 20(1), p.115.
Liversidge, R., Broekhuysen, G. and Thesen, A. (1958) The Birds of Langebaan Lagoon. Ostrich, 29(3), pp.95-106.
Mendez, V., Gill, J., Burton, N., Austin, G., Petchey, O. and Davies, R. (2011) Functional diversity across space and time: trends in wader communities on British estuaries. Diversity and Distributions, 18(4), pp.356-365.
Oksanen, J., Blanchet, F. G., Friendly, M., Kindt, R., Legendre, P., McGlinn, D., Minchin, P. R., O'Hara, R. B., Simpson, G. L., Solymos, P., Stevens, M. H. H., Szoecs, E. & Wagner, H. (2018) vegan: Communiyy Ecology Package. R package version 2.4-6. https://CRAN.R-project.org/package=vegan
Pringle, J. and Cooper, J. (1975) The Palaearctic wader population of Langebaan Lagoon. Ostrich, 46(3), pp.213-218.
R Core Team (2017) R: A language and environment for statistical computing. R Foundation for Statistical Computing, Vienna, Austria.
Robinson, T., Havenga, B., van der Merwe, M. & Jackson, S. (2017) Mind the gap – context dependency in invasive species impacts: a case study of the ascidian Ciona robusta. NeoBiota, 32, pp.127-141.
Summers, R., Cooper, J. and Pringle, J. (1977) Distribution and numbers of coastal waders (Charadrii) in the Southwestern Cape, South Africa, Summer 1975–76. Ostrich, 48(3-4), pp.85-97.
Turpie, J. K. (1995) Prioritizing South African estuaries for conservation: A practical example using waterbirds. Biological Conservation, 74(3), pp.175-185.
Underhill, L. (1987) Waders (Charadrii) and other waterbirds at Langbaan Lagoon, South Africa, 1975–1986. Ostrich, 58(4), pp.145-155.
Vavrek, M. J. (2011) fossil: palaeoecological and palaeogeographical analysis tools. Palaeontologia Electronica, 14:1T. http://palaeo-electronica.org/2011_1/238/index.html.
Whelan, MB., Hume, TM., Sager, PM., Shankar, U. and Lifting, R. (2003) Relationship between physical characteristics of estuaries and the size and diversity of wader populations in the North Island of New Zealand. Norornis, 50, pp.11-22.
Wolda, H. (1981) Similarity indices, sample size and diversity. Oecologia, 50(3), pp.296-302.
Żmihorski, M., Berg, Å. and Pärt, T. (2016). Forest clear-cuts as additional habitat for breeding farmland birds in crisis. Agriculture, Ecosystems & Environment, 233, pp.291-297.
Congratulations @kiekie! You have received a personal award!
Click on the badge to view your Board of Honor.
Do not miss the last post from @steemitboard:
SteemitBoard World Cup Contest - The results, the winners and the prizes