Promoting Steem On Twitter. Today Topic. Steem/Usd Price Analysis of 07.01.2020.
I share steem/usd analysis here at 29th december 2019.That time was christmas holiday and daily volume and volatility was very low due to holiday.The first week of 2020 going on.So many things changes in this week.Traders again join party and volatility goes high than last week.
Steem/usd Info
Steem rank 83th (-3 decrease from 29th december)now based on total market capital(source:coingecko)
total supply 367 million
circulating supply 324 million
current daily trading volume of yesterday was above 3 lakh usd.(near 4 lakh usd was in 29th december.)
Steem All time high was 8.19$ in january 2018
Steem All time low was 0.07 in mar 2017
Total Market capital above 41 million usd (near 43 million dollar was in 29th december.)
Today price 12.46 cent (13.20 cent at 29th december).

Still no noticeable improvement of daily volume.I think holiday mode still going on.Most of the traders still out of market.May be next week they will join the market.I think not any major change in technical base.Also no major any fundamental news about steem or crypto.But new month new year started.This time i will highlight market sentiment also.
Already crypto downtrend pass 2 years.We still can not say it goes over.But personally me, i think some major crypto completed bottom level of ongoing downtrend channel.
This is my previous article about analysis of steem which is posted at 22th december.
Technical Analysis
Last few month market movement followed the technical terms.Because without any major fundemantal news, price unable to go up and finish downtrend.Traders has lack of confidence.Thats why they still depend on short term movement.
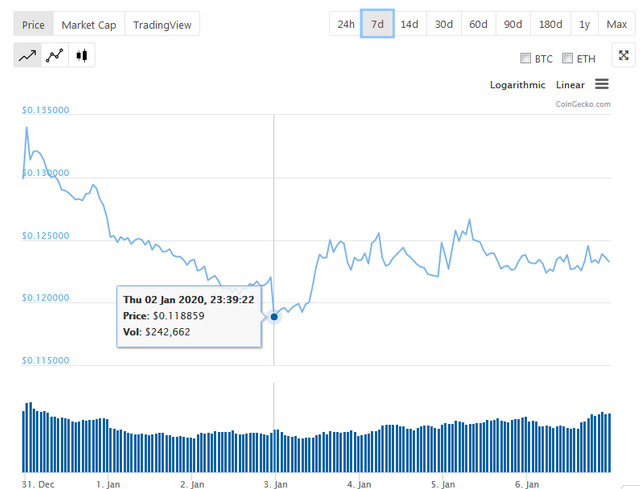
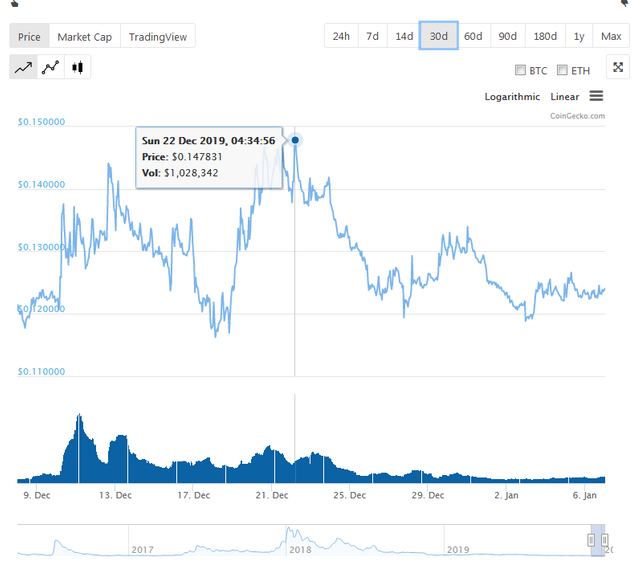
Daily Chart Of steem/usd
Here we can see some improvement happen on daily chart.Price was unable to stay under 12 cent.Twice time rejected from below 12.So, short term buyer take control market when price gone near 12 cent.Today also good day for crypto.Just now i have seen xrp also jump to 21 cent from 19 cent.
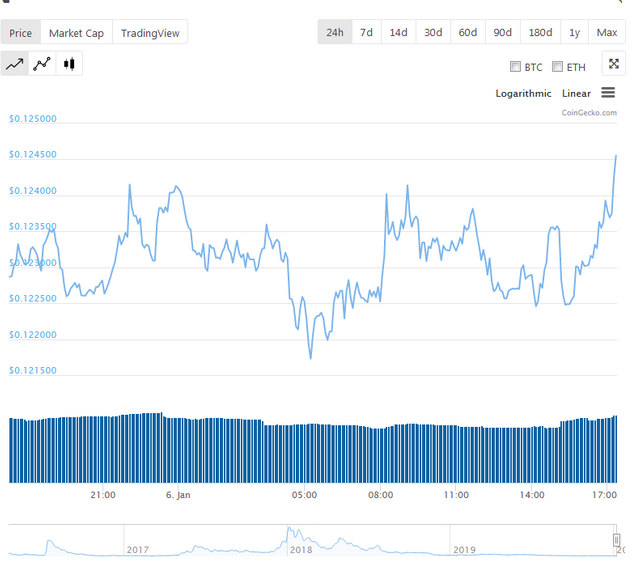
Daily High 12.45 cent
Daily low 12.17 cent
This is the common chart which i have been seeing since october.Price got rejection when price reached 12.15 or 12.20 area.It happened 2 times to day.It is a good day for short term trader.You can buy from down level and close your position when it goes above 12.40 cent.
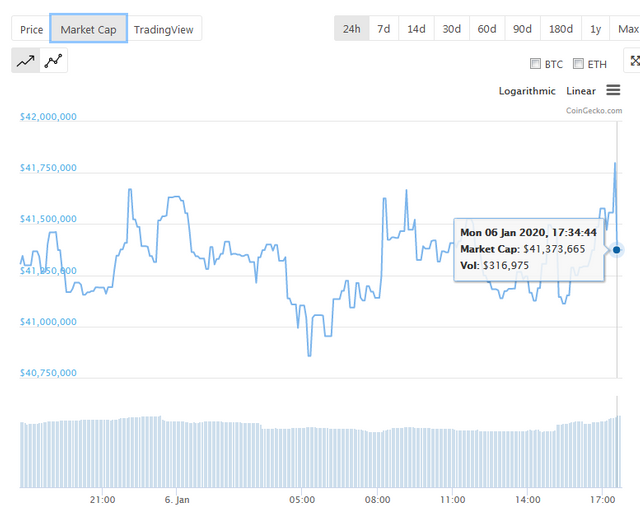
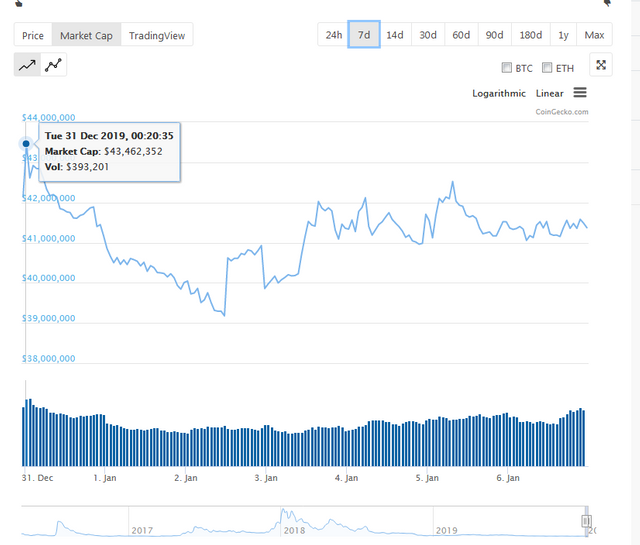
Market capital in Daily chart
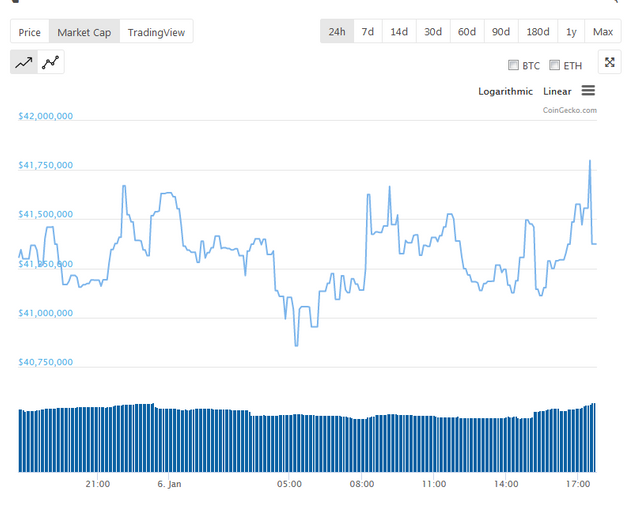
Today high 41.85 million
Today low 40.79 million
I wanted to see a different chart.But same story here like previous week.Just few minutes ago market down slightly. So, in daily chart upmove also not stable.When the price goes above 12.40 cent, then seller take the control of market.
Now i want to focus on daily volume.
Today high 309k
Today low 268k
This quantity really reflect abcent of traders.Happy new year holiday still going on.People are busy with family tour.
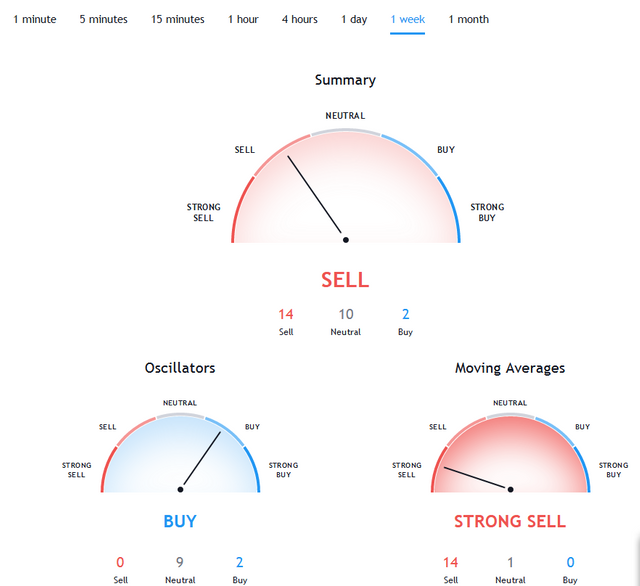
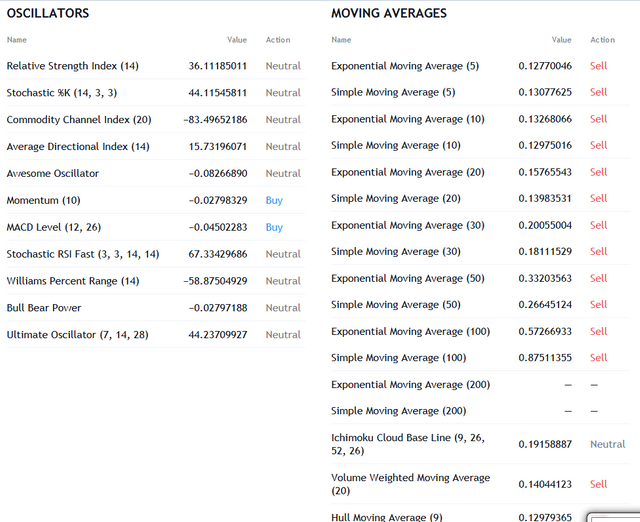
Moving average and Oscillator in Daily chart
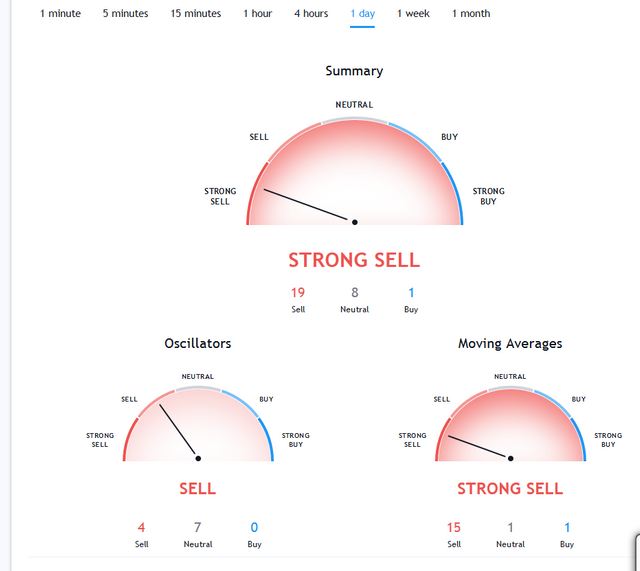
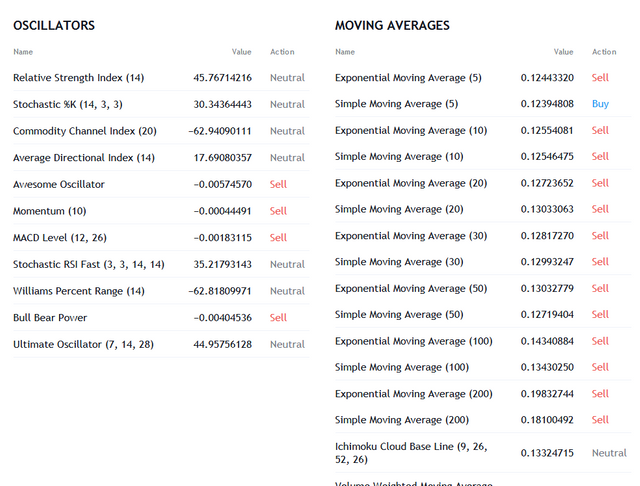
Oscilator and moving average both showing strong sell.We know heavy downtrend is going on.So, without noticcable bullish news market can not change the bearish sentiment of trader.Only simple moving average(5) showing buy.It has no value.Because long term moving average can change the scenario.
Weekly Chart steem/usd
Before seeing chart, i think we can see the same story here.But we can trace the rejection point of this week.That is important.Although holiday going on but new year is come with new hope.

weekly high 13.40 at 31st december
weekly low 11.88 at 2nd january
Please noticed it, this week price again test 11.88-11.94 area.But that was short lived.Before 12 cent price was not stable.The bottom point of this downtrend (My thinking) still not found.I think before up move it can test bottom even it can create all time low as a bottom.
Market capital in weekly chart
Weekly high 43.46 million at 31st december
weekly low 39.17 million at 02nd january
This chart indicate very tight sideway channel.Market capital fall at 2nd january due to price fall and low volatility.We have to see weekly trading volume.
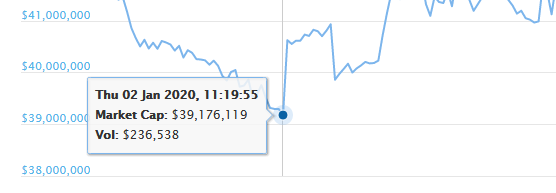
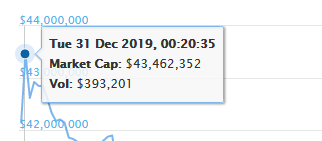
At 2nd january daily volume was weekly low.And 31st december was weekly high volume.I am not happy with this.Because Daily volume became low since november.
Moving Average and oscillator in weekly chart
Oscilator showing buy signal with very narrow ration.But moving average showing strong sell signal.Both are confusing.Because according to chart it is totally bearish move.Some slight pump happened last week from lower high.
That could not change original scenario.
Steem/usd Monthly chart
Best chart of analysis.Maximum forex trader rely on monthly chart.I have some fear that i think month chart also show the negative price movement.
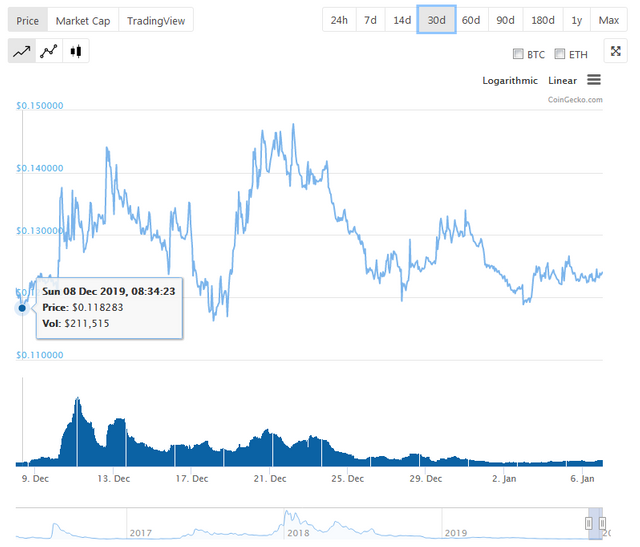
Monthly high 14.78 at 22th december
Monthly low 11.82 at 8th december
I this monthly chart price movement cover the broader area in first decade.Now the chart became narrow channel.This sideways move is very dangerous.Anytime it can choose its own way.
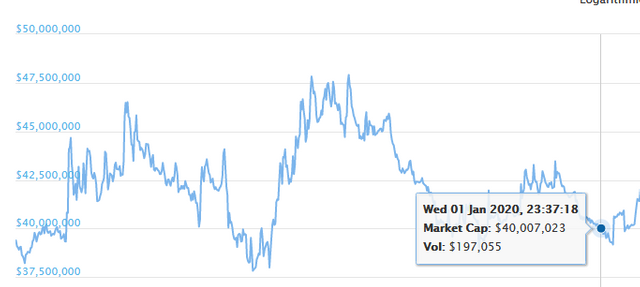
Market capital in Monthly chart
Monthly high 47.50 million at 22nd december
Monthly low 37.94 million at 18th december
Today market capital above 41 million dollar.If we compare with 22nd december market capital drop huge.It depends on price up and fall statistics.From last few month market capital falling slowly.
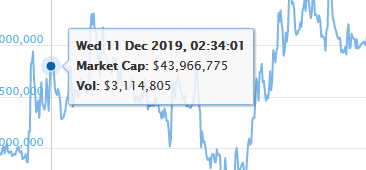
Daily volume high above 3 million dollar at 11th december in monthly chart
Daily volume low was 197k at 2nd january in monthly chart
See how the daily volume dropped in this month.Are trader fed up with steem?Or they are interested with others coin.Because this is the first time daily volume drooped huge.
Moving Average and oscillator on Monthly chart
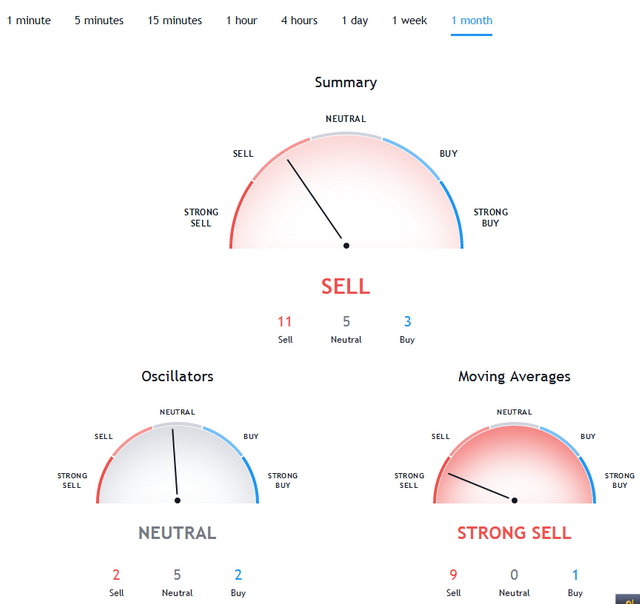
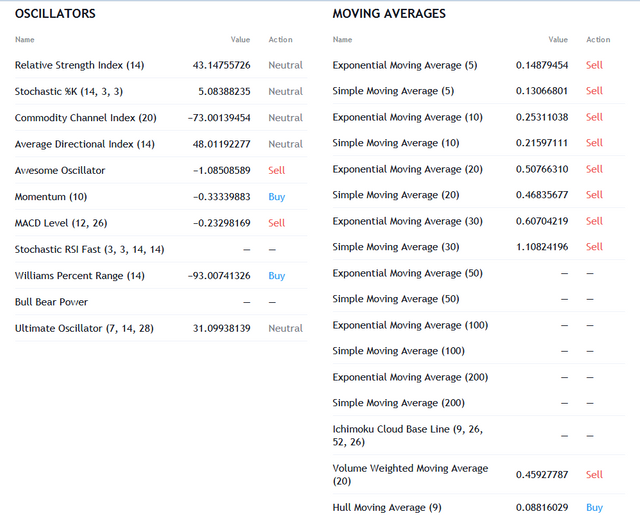
Red color cover the full area.I said earlier monthly chart can not show us any positive momentum.Everywhere is red.11 out of 19 indicator showing sell.Only 6 show buy.
We can say bear takes full control of market.
Fundamental Analysis

I am good at fundemantal than technical.I rely fundemantal most.Still no good news for steem and crypto.Justin sun rumor dead now.
Another news is steem media token (SMT)confirm coming at january 2020.we all are waiting for it.
I want to say it will be good if you trade short term.Just open buy at lower high and open sell at higher low.But be careful with higher low.You have to be smart this area.
I hope we can see established bullish momentum at 2020.Already 2 years gone.We want to get back another golden year of crypto.It can be 2020 or 2021.
All screenshot taken from
https://www.tradingview.com/symbols/STEEMUSD/technicals/
https://www.coingecko.com/en/coins/steem
Our steem promotion on social media is going on.New people joining everyday on steem.
.png)
Our motto is
Spread Steem Worldwide

.png)
%20(1)(2).png)
Find this article on twitter with tag #steem #posh #steemtweets #steemit for promoting steem to other social media.
https://twitter.com/khokand26318088/status/1214260585392672769
@tipu curate
Upvoted 👌 (Mana: 5/10 - need recharge?)