Promoting Steem on Twitter. Today Topic. STEEM/USD Weekly Price Analysis 29.12.2019
I post here my last weekly analysis about steem 22th december.I want to share my analysis of this week.This is not positive momentum still now.Although holidays is going on.
Steem/usd Info
Steem rank 80th (-2 decrease from 22th december)now based on total market capital(source:coingecko)
total supply 367 million
circulating supply 324 million
current daily trading volume of yesterday was near 4 lakh usd.(above 8 lakh usd was in 22th december.)
Steem All time high was 8.19$ in january 2018
Steem All time low was 0.07 in mar 2017
Total Market capital near 43 million usd (above 45 million dollar was in 22th december.)
Today price 13.20 cent.

So we can see here huge drop of daily trade volume.Market capital also slight decrease.But price is in stable area.Why daily volume decrease near 50%.I think trader withdrawn their money cause of merry Christmas this week.After january 1st week i hope market volatility will bring back.
This is my previous article about analysis of steem which is posted at 22th december.
https://steemit.com/promo-steem/@shharafat/promoting-steem-on-twitter-today-topic-steem-price-analysis-22-12-2019
Technical Analysis
It is not my favorite area.It has so many advantages.Even when market goes in sideways move then technical analysis is perfect for make profit.Last week of december 2019 going on.We already been sure 2019 is also a worst year for crypto.

Daily Chart Of steem/usd
Today is some better improvement on chart than yesterday.Yesterday price again touched 12 cent.Today it recover slight.
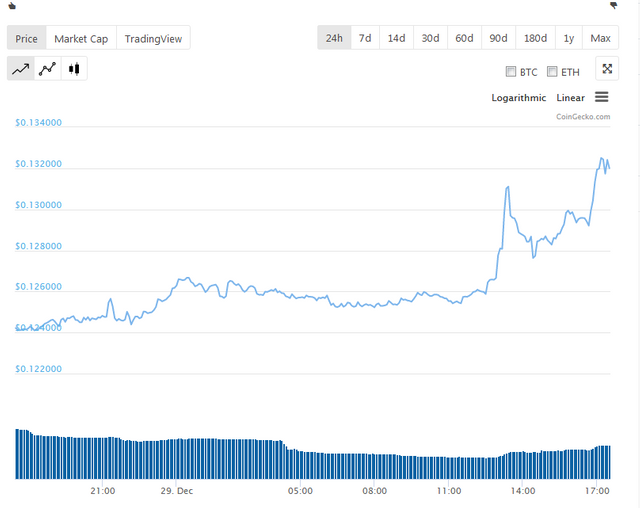
Daily High 13.25 cent
Daily low 12.41 cent
Some recovery symptom.Market has low volatility.Spread is also high now.Daily volume drop rapidly.It is a normal matter in Christmas time.Forex market also has now low volatility with high spread.Biggest holiday of year is going on until 1st january 2020.
Market capital in Daily chart
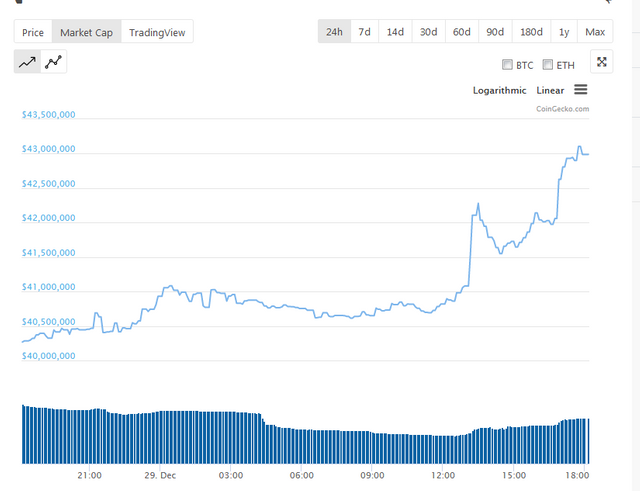
Today high 43 million
Today low 40 million
It shows marget going on under tight sideways channel.Maximum trader is in holiday mode.They are spending their time with family and enjoy Christmas. Good news is price recover from another lower high point.
This is positive things for steem.
Moving average and Oscillator in Daily chart
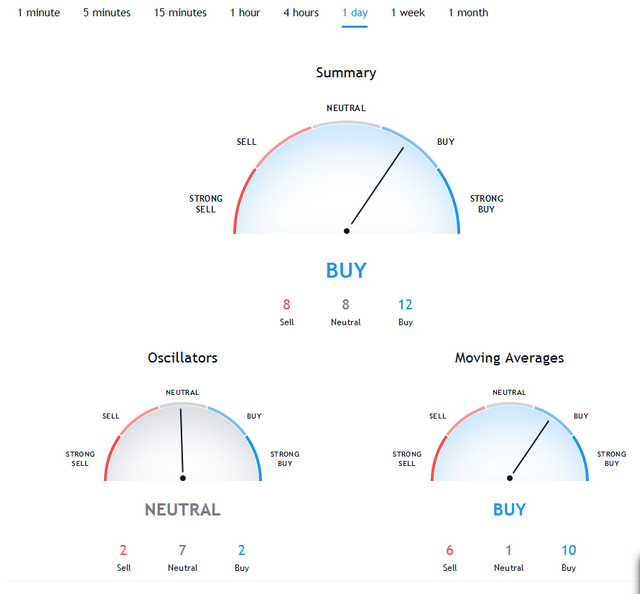
Moving average show here bullish signal.Not all the indicator show bullish.10 out of 17 show bullish and only 1 indicator show sell.Rest othe indicator show neutral.
Oscillator shows neutral.2 buy signal and 2 sell signal.Rest of indicator shows neutral.Overall we can say daily trade signal is bullish.I am not saying it will break next resistance 14.15 in this week.But we can hope it january 1st week.
Weekly Chart steem/usd
This is one of broader time frame chart.For daily and weekly trading this time frame is useful most.
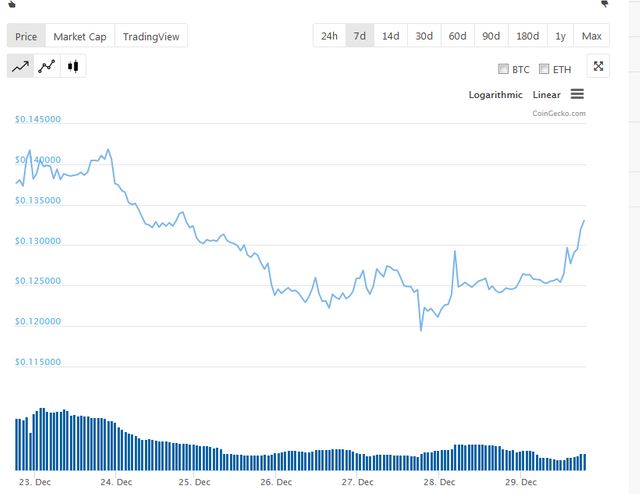
weekly high 14.18 at 23rd december
weekly low 11.94 at 27th december
Again price tried to go support but unable to make it.By seeing this chart i assume moving average must give sell signal in weekly time frame.Price is now 13.20. So, fall from high and touch 11.94. Again price recover from that point.This time it will attempt to break previous week high.
Market capital in weekly chart
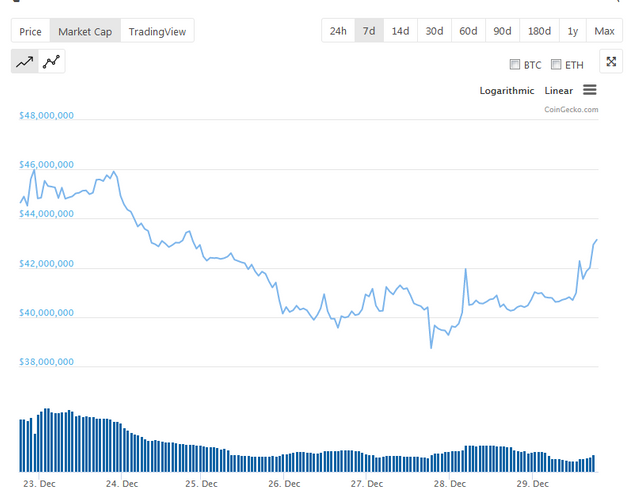
Weekly high above 475 million at 23 rd december
weekly low above 38 million at 27 th december
Market capital fall due to price was falling this week.Daily trade volume is not up to the mark.At 23rd december daily trading volume was above 1 million usd.Now it fall heavily.People withdraw money from market.
Moving Average and oscillator in weekly chart
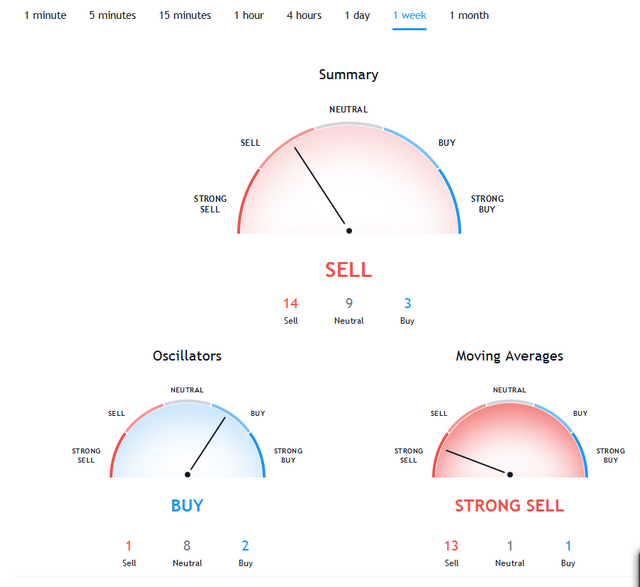
I said earlier.Moving average must signal sell in this week.13 out of 15 indicator show seel signal.It means it is strong sell signal.Although oscillator showing buy signal overall with very tight ratio.
Previous week i said price is going to positive momentum but it not happen.Again weekly channel refuse to go high.Resistance is very far from this point.Now the critical time for trading.
Steem/usd Monthly chart
We can get perfect trading signal from monthly chart.Earlier i started my analysis with monthly chart.But is is very difficult to understand analysis from higher time frame to lower time frame.So, i change my analysis.I am now sharing monthly chart at last.
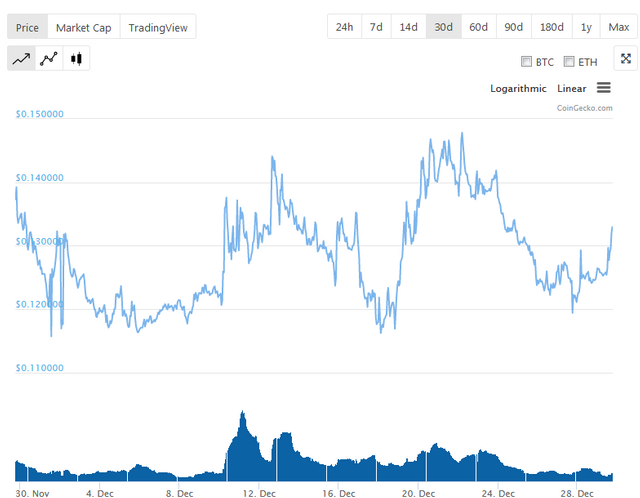
Monthly high 14.60 at 22th decmber
Monthly low 11.57 at 1st december
What a perfect sideways chart.Simple trading.Buy from 11 11.50 12.00 and close position to 13 13.50 14 .Tight range under low volatility.Leave trading when price goes to strong support at 10.64 and strong resistance at 14.54 .
Market capital in daily chart
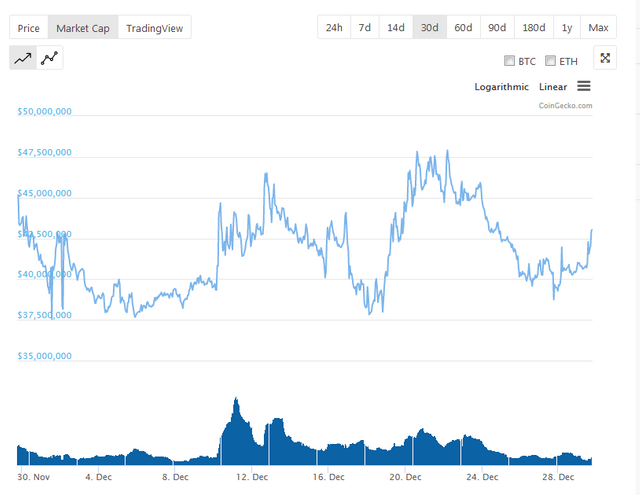
Monthly high above 47 million at 22th december
Monthly low Below 37 million at 1st december
Now market capital near 43 million dollar.Although capital decrease a lot from last week.But still has so many positive thing.Last 3 days daily volume is very low.It goes below 4 lakh usd.I hope it will increase a lot very soon after holiday.
Moving Average and oscillator on Monthly chart
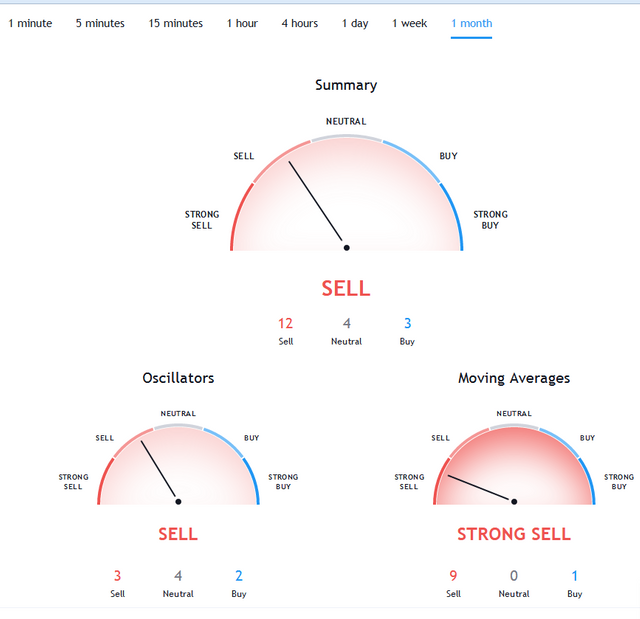
Everywhere is red.And all indicator show sell signal.Previous analysis i said i would sure the clear momentum next week.So this week again chart giving a threat to break support.Support is not so far from this point.But still now i mention that lower point to bottom.
Fundamental Analysis
I rely fundamental most.But no improvement about positive and negetive both.Justin sun rumor stop now.In broader view no big news about crypto.We heard that binance enter to india market via wazirfx.I can not say how indian government will react about it.Still no news.
Another news is steem media token (SMT)confirm coming at january 2020.we all are waiting for it.
My trading view is this is not time for long term trading.If you trade long term then one option is better.That is buy.Best trade is now buy from lower level and sell from higher level.But you should be alert with breakout.
2018 and 2019 year already proved worst for crypto.I think 2020 will be turning point for crypto.In 2020 it has more possibility to over come from bottom position and bring a stable bullish momentum.
All screenshot taken from
https://www.tradingview.com/symbols/STEEMUSD/technicals/
https://coincheckup.com/coins/steem/charts
https://www.coingecko.com/en/coins/steem
Our steem promotion on social media is going on.New people joining everyday on steem.
Our motto is
Spred Steem Worldwide
.png)
(1).png)
.png)
%20(1)(2).png)
Find this article on twitter with tag #steem #steemit #posh #steemtweets #youtubeisover for promoting steemit to other social media.
https://twitter.com/khokand26318088/status/1211277117528240129?s=19
Posted using Partiko Android