TRADING: The Holy Grail of Forecasting [PART 2/2]

Technical Analysts drool when they see GARCH in action, and they realize that their tools are worthless junk compared to the elegance and accuracy of what GARCH provides. GARCH is pretty much the Holy Grail of forecasting.
Check out the previous articles, this is a continuation of it:
- https://steemit.com/mathematics/@profitgenerator/trading-moving-average-crossovers-useful-part-1-2
- https://steemit.com/mathematics/@profitgenerator/technical-analysis-and-normal-distribution
GARCH = generalized autoregressive conditional heteroscedasticity, it is a special variant of the ARCH family, and there are many variants out there: NGARCH, EGARCH, IGARCH, you name it.
GARCH is used to model volatility and forecast volatility, volatility measured in variance but it could be done in returns, log returns and such. Garch doesn't work on non-stationary data, therefore all data needs at least a level of differentiation, hence it only models variance in the price, but not the price itself.
Why is it useful?
Well it is very accurate, way more accurate than ARIMA models, and it's pretty much the best forecasting tool there is, except some super AI Neural Network, but even then it's questionable. I've read many research papers and unless you can train your NN on good data and make it flexible learning, GARCH is still the best quant tool in my opinion.
So I've saved the best for last, it forecasts the variance, which can be used to calculate future price opportunity & risk. Specifically useful for OPTIONS, used together with Black-Scholes formula, it can make some money. But not just that, in this article I will reveal to you the real power of GARCH on reconstructed price based volatility forecasting.
GARCH
GARCH(p,q) basically looks like this:
It is like an enhanced ARMA(p,q) model, but it's squared. The
p part is the autoregressive part, and the q part is the moving average part. Where q>0 and p>=0 and p+q<5, so there are not many combinations, so less subjectivity is involved. There is also a constant parameter, which is optional, but rarely needed since stationary data rarely has constants > 0. Note that GARCH doesn't have a d parameter for differentiation, since the data itself should be differentiated when we talk about variance.
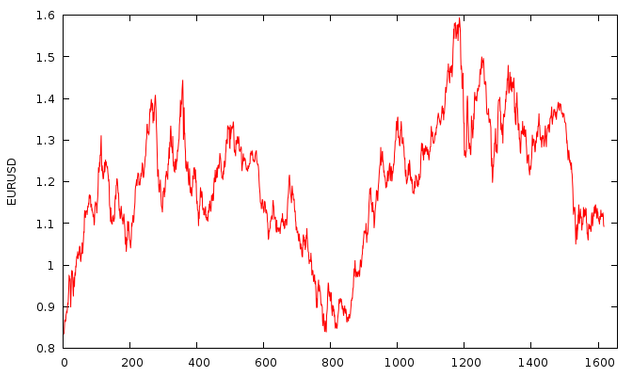
We will use the same data as in the previous article:
I have here weekly EURUSD data since the 80's made up of 1617 datapoints, and we shall work with this one in this article.
Then we differentiate it, I will use natural logarithm differentiation, because my research shows that it's
+17.802144642% more efficient than normal differentiation.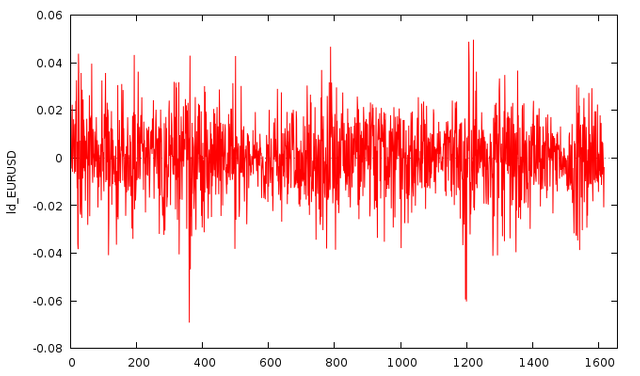
Now we test the parameters, using a PACF or ACF test, we determine that 1 lag has the highest autocorrelation value, so I have tested all combinations with 1, and turns out GARCH(1,1) without constant is the best one in this case. So we model it:
Now this model is very good, but just to check it, we can test whether the residuals are normally distributed:
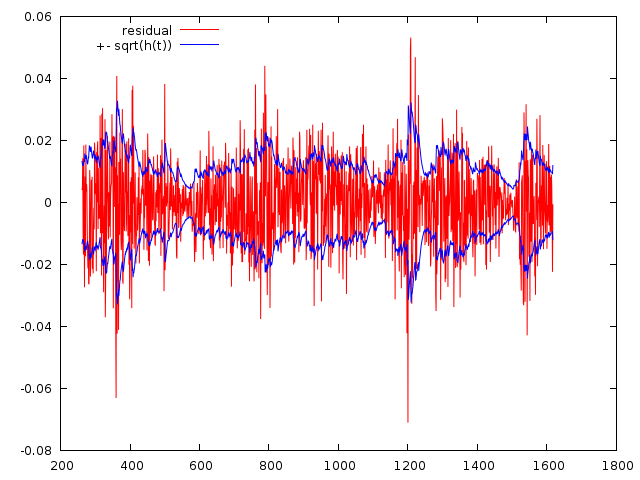
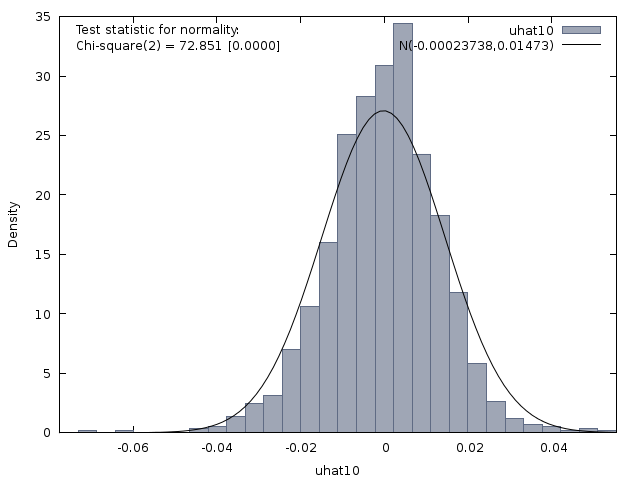
And yes they are p<5% , Chi-square(2) = 72.851 with p-value 0.00000, so we see that this model is the best for this data. The fitted model has a Mean Absolute Error of 0.010195
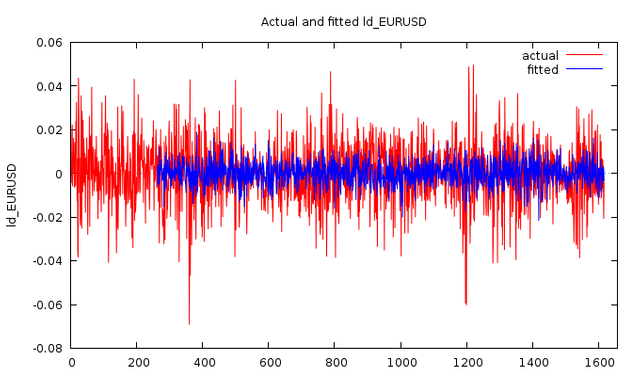
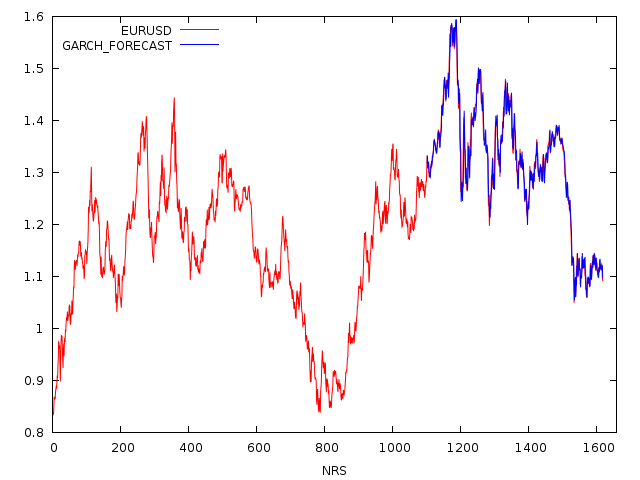
Then we plot the fitted data on the chart by reconstructing the price from past price x GARCH volatility:
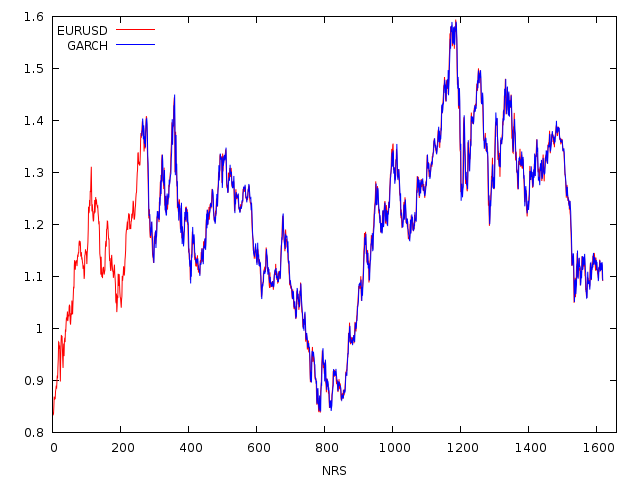
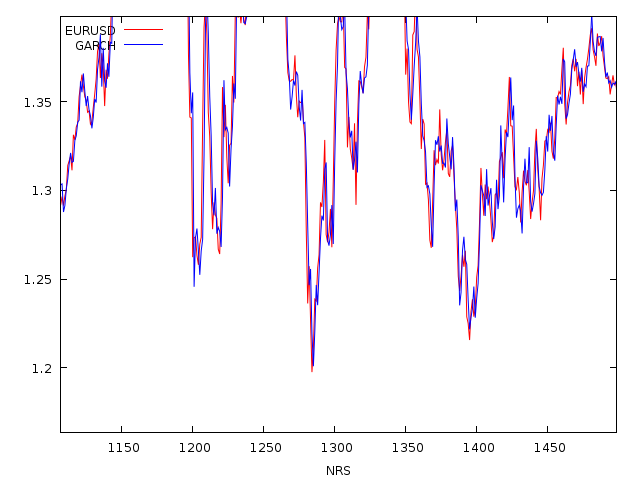
So far so good, the fit is very good with 99.43852% accuracy, now it's time to forecast the latter part of the data from the rest of the data, about 416 elements. This is the exciting part:
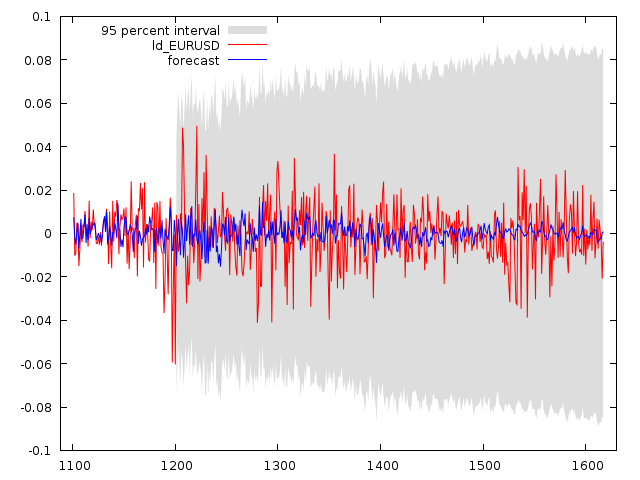
It looks like a Mean Absolute Error of 0.011484, not too far from the fitted data, therefore the model is very very good.
And voila, this is the HOLY GRAIL:
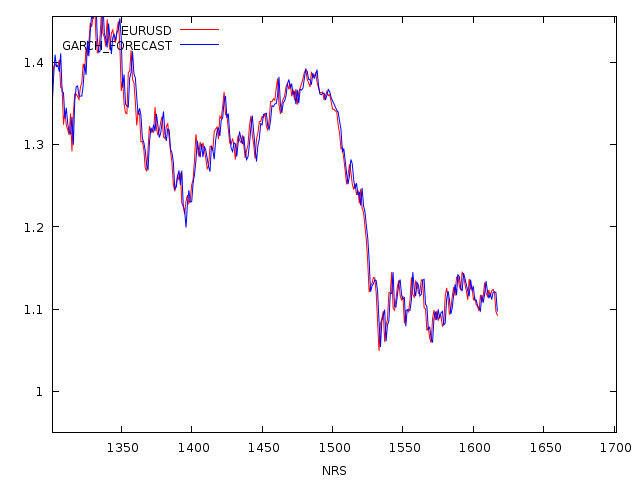
98.72991% accuracy at forecasting future data
And this is weekly data, if we'd had tick data with a supercomputer, to add more lag orders to it, we would have pretty much 100% accurate forecasts. But this I can do in about 30 minutes of calculation.
The forecasted ln diff has to be reconstructed and added to the data of the previous values, but this is how you can essentially use GARCH to forecast prices, very accurately. It is by far the best tool in my opinion.
So yea technical analysts are drooling now, as their junk indicators can't forecast shit, while real scientific tools make big bucks from price forecasts. The hedgefund giants definitely make a lot of money from this.
Disclaimer: The information provided on this page might be incorrect. I am not responsible if you lose money using the information on this page! This is not an investment advice, just my opinion and analysis for educational purposes.
Credits:
[1] Original Photo: http://8bitchimp.com/the-search-for-my-holy-grail-game/
[2] Formula image via Wikipedia.org
nice animation
This was amazing data and analysis! With over a 99% accuracy rate, any trader would have to be blind not to go with this math. One question though.. Could you further break it down like for instance, buying a bitcoin and breaking down the price against other currency pairs with step by step instructions and links that educate on this math..? Just wondering for myself, thank you!
It's not always this high, it depends on the data and how well you can guess the model, but yes most of the time it has ~90% accuracy rate. The drawback is that GARCH can only forecast 1 datapoint ahead, while it is good for short term, it cannot gauge a long term trend, so best to use it with ARIMA together.
IDK, maybe I should write a book about it or something, it took me 4 years to learn this in college + my years of experience doing quant work, so it's not like it can be learned in 1 night.
Thanks for the post!
Sure no problem, i enjoy writing about this.
Great Post! Did you use R for the modeling and analysis?
I am using many tools but it's doable in R too.