TRADING: Moving Average Crossovers Useful? [PART 1/2]
Sorry for not being active for 2 weeks, but I have been making a lot of money from trading, but I thought I share with you more trading knowledge today, and if you read my posts, you know that I am not talking BS here, only useful trading information.
I have promised in the last article that we will talk about GARCH here, and compare it to Bollinger Bands and Moving Average Crossovers, so we will do that:
https://steemit.com/mathematics/@profitgenerator/technical-analysis-and-normal-distribution
But first I see that I got 177 followers, that is pretty nice, so thanks for following me! It looks like I am getting followers even though I am inactive, it looks like older articles are being read too, this is good!
TECHNICAL INDICATORS OVERVIEW
In the last article, I was talking about how useless the technical indicators are, especially Bollinger Bands that throw out mathematical statistics on the window and uses pretty much pseudo-science to calculate mathematical concepts. The fundamental indicator is the moving average, all technical indicators are build on this:
- RSI, Stochastic, Bollinger Band, MA Crossovers, Golden Cross, you name it...
The moving average itself is a good concept, it is a real mathematical concept, however it is used in the wrong way, in all technical indicators. The problem is that:
- The moving average is giving you the mean of the price, however the price is non-stationary so the mean is always changing, so it becomes a drag to find the right parameters, which is subjective and themselves change too. This is a bad modeling practice, you cannot chase the parameters, it doesn't work that way.
- Even if you find the best parameters, so what? , the
Moving Average Crossoverconcept is pure nonsense, it doesn't work that way. You are essentially comparing 1 estimated mean to another estimated mean? What is that? I have never heard of a mathematical concept like that? It's not even the correct mean, you are just comparing 2 junks and expect something worth coming out of it.
Of course you want to use the MA to smooth the price, but even then, you can use far more efficient tools like Kalman Filter or Lowpass Filters. So there is absolutely no reason at all to use a moving average, even though it is a valid concept, when you apply it to a price data, it becomes useless.
Besides smoothing the price, doesn't give you any information about the future, it just removes noisy data. You need to do interpolation on the data, and extrapolate into the future, once you found the correct mean. So smoothing by itself is still useless.
Therefore, we can conclude that moving average crossovers (and hence all technical indicators built on it) are useless, and the moving average by itself used for smoothing is also useless, unless you start interpolating it.
CHARTS
I have here weekly EURUSD data since the 80's made up of 1617 datapoints, and we shall work with this one in this article. I have daily data too, but the calculations take much too long on that, even though daily data is +50% more accurate, we will work with this now.
Bollinger Band:
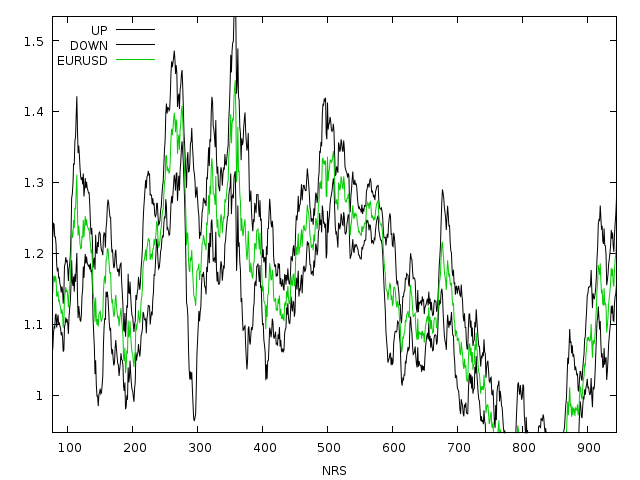
Well, the Bollinger Band is considerably more accurate in high timeframe data, because the noise is less and the price is more seasonal, and the moving average smooths well on seasonal data. Of course this doesn't mean that it's a good tool to use, because it is not using correct calculation, and we have far better tools. It is based on a 2 standard deviation band (calculated wrongly), and a 20 period simple moving average:
20-Period Simple Moving Average:
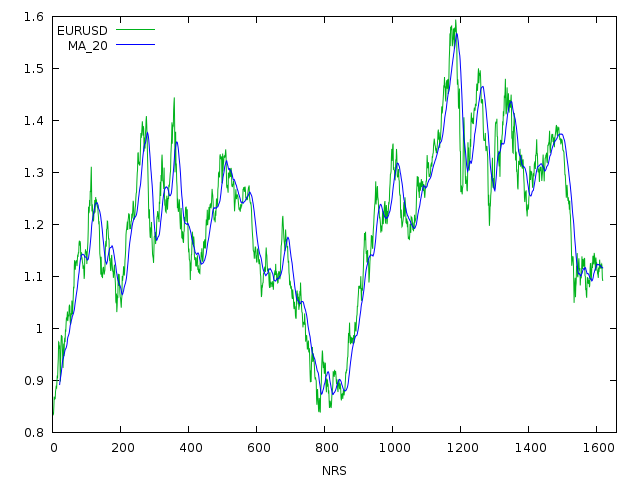
Looks smooth and clean but still it doesn't tell us anything, and if we were to extrapolate from this, it would give us pretty inaccurate forecasts. (It would be an ARIMA(0,0,1), but with inflexible coefficient, which is not accurate for forecasting, in non-stationary data the d>0 and in seasonal data a SARIMA(p,d,q) is preferable, but more on this later!)
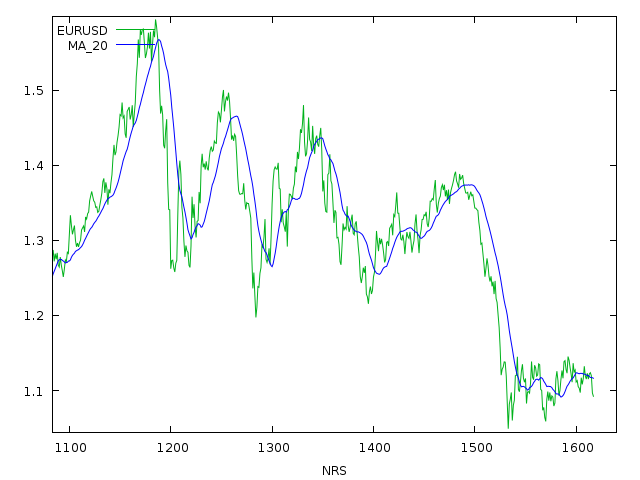
So you would better be off with a SARIMA(p,d,q) for example where d>0, than to use a crappy MA20 or MA40 for extrapolation. Speaking of which let's look at the crossovers:
20-Period & 40-Period Simple Moving Average Crossover:
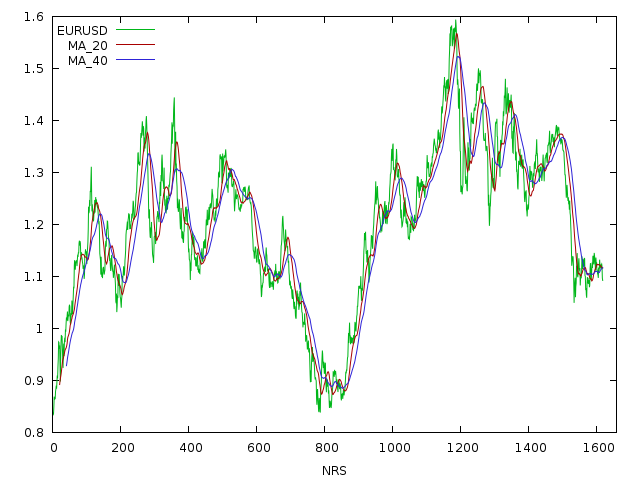
Well as I said earlier, this method is nonsense, and has no statistical meaning. We are essentially comparing 2 badly estimated means, and expect the less badly estimated mean to signal a price change? Please, if you tell this to your math professor, he will cry. And as absurd the idea sounds, it does give some good signals, sometimes, but most of the time will not.

It will either give you too early signals, or too late signals, and when the price is stagnating, it will totally give you bad signals. So you will probably lose money if this is your trading strategy. And I am not saying it's impossible to make money with it, some research (although questionable methodology) has shown that it's possible to trade profitably with crossovers, but why risk it, when we already have real scientific tools, real mathematical, econometric and quantitative analysis tools ,that really work.
So I would definitely no waste my time on pseudo-scientific tools like these technical indicators and it's concepts, and start using real tools that really work.
And don't let the high timeframe fool you, yes it is true that technical indicators give better signals at high timeframes, but this is a bad excuse to use them. There exists no timeframe, it's just an artificial grouping of data, and a good tool has to be able to shine through all groups essentially and auto-adjust itself. For example an ARIMA(1,1,0) is the same valid for a 1H chart as it is for a 15min chart, but an MA alone has to change it's lag parameter.
A good statistical tool, is flexible, and doesn't rely that much on subjective data, and we essentially have 2 great statistical tools that are better than all technical indicators combined: ARIMA (and it's variants) & GARCH (and it's variants).
I have talked about ARIMA previously:
- https://steemit.com/mathematics/@profitgenerator/technical-analysis-and-normal-distribution
- https://steemit.com/trading/@profitgenerator/how-to-measure-the-trend-in-a-market
- https://steemit.com/trading/@profitgenerator/top-reasons-why-you-are-not-making-money-from-trading
- https://steemit.com/steemit/@profitgenerator/scientific-analysis-of-success-on-steemit-1
...and more, follow me for more trading/investing knowledge!
In the next article I will talk about GARCH exclusively, this article was just a warmup for what it is to come. And boy, when you will see the power of GARCH, you will want to throw out all your technical analysis books into the trash can.
Disclaimer: The information provided on this page might be incorrect. I am not responsible if you lose money using the information on this page! This is not an investment advice, just my opinion and analysis for educational purposes.
Interesting, if only for the math behind it all.
Well, it has its drawbacks, but at least its working.
Some insightful articles recently. I threw out TA a long time ago. I just trade price action, although I haven't really dug too deeply into quant tools. Thanks!
What is price action? Sounds subjective to me. The whole point is to eliminate subjectivity because the human brain cant process mathematical data, so we rely on machines and math to do it.
This would be the point of TA tools, but where they fail, quant tools prevail. You should check out quant tools.
Subjective, sure, but profitable. Price action is a naked chart with no indicators, based mainly on an abstract understanding of probability combined with time of day or month patterns and tape reading. I touched on the basics of quant tools at university along with some econometrics. You've definitely given me a nudge to pursue it further.
Well I am afraid those chart patterns are bunk too, i read research papers analyzing them and almost all of them had negative expectancy. Although if I remember correctly the
morning starpattern had positive expectancy, not big and only in stock markets, I am not sure.Besides it's hard to quantify, the human brain sees patterns where there isnt. Although you should look into the chart pattern research, I know a few papers have touched the subject:
https://arxiv.org/ftp/arxiv/papers/1111/1111.5892.pdf
https://arxiv.org/abs/1111.5892
But as I said, the candlestick charts give the illusion of patterns, that is why I use line charts. And I tend to rely more on objective analysis, rather than subjective, it decreases risk.
By patterns I'm referring more to behavioural patterns. Such as there's a big oil seller over settlement (2 min window)price comes off and then pushes back overnight.
As for chart patterns, they're contextual and I mainly trade gambits of info. Like if price is ranging between 5 and 10 it's more likely to hold if it quickly spikes to support or resistance rather then slowly pushing toward the highs or lows and slowly pushing out. All psychological of course, but you can see it on the chart and ladders.
But each to their own in trading, I think it's mainly about sticking to an approach that works with your personality and skillet.
Well as long a we are making money, who cares about the strategy right?
great! ffs finally who makes a good case against those TA posts that make so much money...in steemit :D for what?
grrr. following and looking forward to your next one!
TA analysts make money by selling books not by trading. Quants make money, but most of the time they do risk analysis for hedgefunds and stop funds losing money. Quants are mostly in the risk management business, but it could work as a trading strategy too if it's well planned out.