How to measure the Trend in a Market?
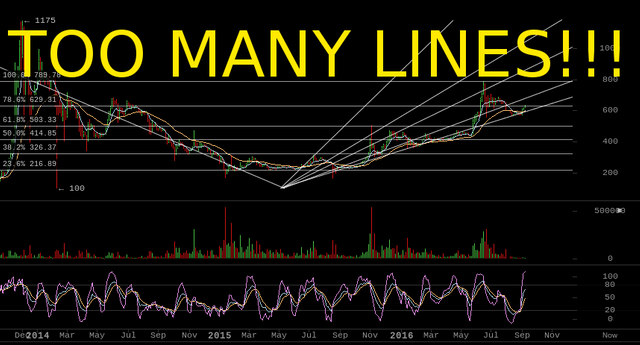
Everyone can draw pretty trendlines on a chart, but they are very subjective and they will not tell you any useful information about your price chart. They are subjective, and work very well on past data, but have almost no predictive power on future data.
Whenever one price top doesn't fit the trendline, you just redraw the trendline on a new top, so all that you are doing is fitting the line to the price, which any 5 year old can do, but it won't tell you anything about it's structure.
I have criticized technical analysis in my previous article, and I still stand aside this belief, that TA doesn't have any predictive power, since it's subjective and non quantifiable.
Sure anyone can draw pretty lines on the chart, but that is not science, that is art. We can't make money in trading from art, we need scientific tools.
So say goodbye to your trendlines, fibonacci fans, fibonacci extensions, moving averages and chart indicators. MA is technically good but not the way you are using it right now, definitely not the MA crossovers technique, I find that nonsense.
What is a Trend?

First if we want to measure a trend, we must know what is a trend. Well it is definitely not a silly trendline, nor is it a quackery fibonacci stuff, and absolutely not a 50 period MA crossover, these concepts are so absurd, that any serious econometrist will pull his hair off when he hears them. The Technical Analysis world is full of superstitions and quackery like these, but these are not scientific at all.
So what is a Trend?
A Trend is a characteristic of a data series, when the data is non-stationary, which means that the average, the variance and the covariance is not constant. A non-stationary data has a unit root, but doesn't always have a trend.
Basically all trending data is non-stationary but not all non-stationary data has a trend, the data model could have a constant in it.
To measure a trend objectively we will use econometric tools. We always test for unit a root to prove the existence of a trend. I will demonstrate in this article the ADF unit root test. There are many more tools, but the ADF is the most popular and widely used, despite it's criticisms, it is pretty accurate.
Augmented Dickey–Fuller Test
Now you can use any statistical tool to calculate this like Stata or Mathematica or others, I just use my python scripts and other custom tools.I am using the Akaike Information Criterion on the ADF test for the record.
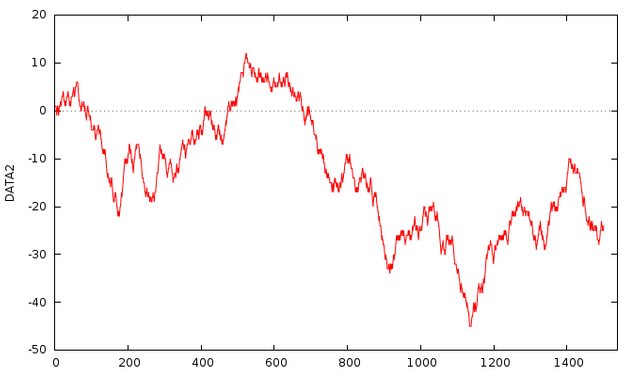
For this experiment I have selected 3 data series: DATA2, DATA4 and DATA5
DATA2
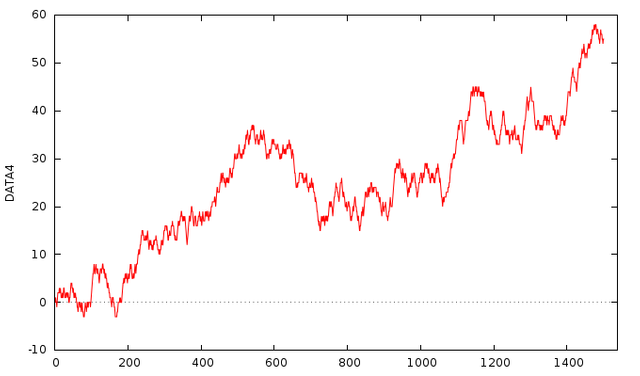
DATA4
DATA5
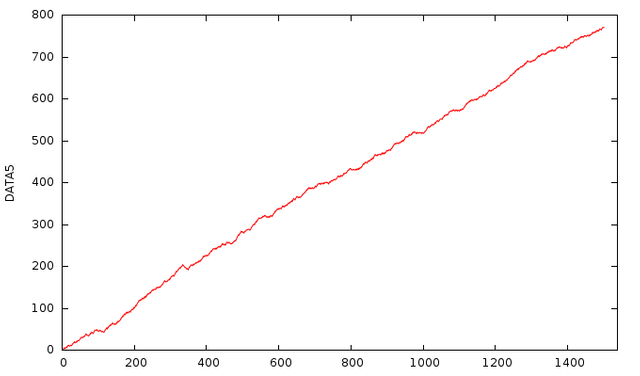
They were all generated using Random Walk a model with different levels of drift. All data series have 1500 elements. As you can see visually, the trend is stronger at DATA5 and less strong in DATA4 and even weaker in DATA2 if there is any.
But of course visually verifying it is too subjective, so we test for unit root. The null hypothesis of the ADF test is that the data is non stationary:
- If the
pvalue is less than our criteria, typically 0.05, then we reject the null hypothesis and the data is stationary - If the
pvalue is more than our criteria, typically 0.05, then we accept the null hypothesis and the data is non-stationary
So I ran the ADF test with AIC criteria with 40 lag parameters. As a rule of thumb you take the square root of the sample size and round it up, so just to make sure I use 40 maximum lags.
| Type | DATA2 | DATA4 | DATA5 |
|---|---|---|---|
| test without constant | (1-L)y = (a-1)*y(-1) + ... + e | ||
| p-value | 0.546 | 0.9215 | 0.9955 |
| test with constant | (1-L)y = b0 + (a-1)*y(-1) + ... + e | ||
| p-value | 0.5879 | 0.7907 | 0.6693 |
| with constant and trend | (1-L)y = b0 + b1*t + (a-1)*y(-1) + ... + e | ||
| p-value | 0.7802 | 0.4884 | 0.8728 |
| with constant and quadratic trend | (1-L)y = b0 + b1*t + b2*t^2 + (a-1)*y(-1) + ... + e | ||
| p-value | 0.926 | 0.759 | 0.7063 |
As you can see DATA2 could have a constant, while DATA4 and DATA5 has a very high chance that they don't have a constant. While DATA2 likely has a quadratic trend, DATA4 could have a linear or quadratic trend where the quadratic is more likely, and DATA5 more likely has a linear trend than quadratic.
We can only know for sure when we model it and start forecasting from it, but the ADF test, still gives us decent information about the setup of our data series. Then you can run an additional KPSS test on it, but that is more complicated as it requires differentiation, the ADF still remains the easiest and the most popular.
This is how you measure the trend scientifically, and not with mumbo-jumbo technical analysis tools.
Image Sources:
https://bitcoinwisdom.com
https://pixabay.com